Runtime analysis is an integral part of most application security assessment processes. Many powerful tools have been developed to perform execution/data flow analysis and code debugging for desktop and server operating systems. Although a few dynamic analysis tools such as DroidBox are available for Android, I currently know of no similar public tools for the Windows Phone 7 platform. The main challenge for Windows Phone 7 is the lack of a programable debugging interface in both the Emulator and phone devices. The Visual Studio 2010 debugger for Phone applications does not have an “Attach to process” feature and can only be used to debug applications for which the source code is available. Although the Kernel Independent Transport Layer (KITL) can be enabled on some Windows Phone devices at boot time which could be very useful for Kernel and unmanged code debugging, it can’t be used directly for code tracing of phone applications which are executed by the .NET compact framework.
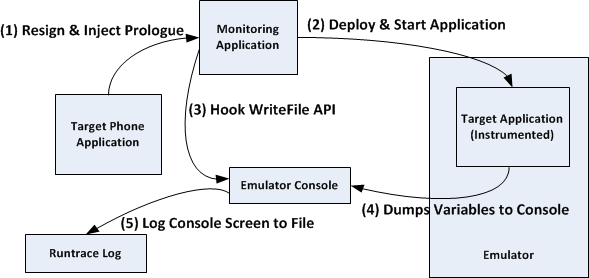
The following figure demonstrates an overview of the process which I have used to record the execution and data flow of Windows Phone 7 applications without using a debugger:
The instrumented phone application prints out method names and variables to the emulator console (that can be enabled by adding a registry key) at runtime. The console window buffer is then captured by an API Hook (WriteFile API) in the emulator process and saved to the runtrace file. I have developed a tool named “XAP Spy” in C# to automate the above process. You will need Windows Phone 7 SDK, .NET freamworks 4.0 and 2.0 (The API hook code is based on EasyHook library which only works with .NET framework 2.0) to run this tool.
Runtime analysis demo of a WP7 software token
Update (9/21/2011): XAP Spy binaries for Windows Phone SDK7.1 can be downloaded here.

