Intro
Last Christmas I was doing quite a bit of research around an exploit for Chrome’s JavaScript engine, V8. While most of the concepts around the exploit might seem familiar: for example, what is known as a Type Confusion today has the almost exact concept (or outcome) as a Use-After-Free vulnerability, one of the differences is that there is no free/malloc exploited directly; there is a huge difference in the root cause of the exploitability of Type Confusion vulnerabilities. This is due to the optimisation phases that happen in the JavaScript engine before the Type Confusion bug is triggered. Because of this, after tackling an exploit and realising there’s so much about the internals that I needed to know, I tried getting my head around the tooling and the optimisation pipeline happening within V8, by reading the code and working on some examples while supporting myself on an amazing tool called Turbolizer by the v8 dev team.
If you want to follow along, which should be fairly easy to do, execute the following command in your terminal:
git clone https://chromium.googlesource.com/chromium/tools/depot_tools.git && cd depot_tools && echo "export PATH=\$PATH:`pwd`" >> ~/.bashrc
source ~/.bashrc && cd ~ && mkdir v8_turbolizer && cd v8_turbolizer && fetch v8
./v8/build/install-build-deps.sh
./v8/tools/dev/gm.py x64.debug d8
cd ./v8/tools/turbolizer/ && npm i && npm run-script build
These commands might take a while, depending on your network speed and CPU power to build V8.
V8 ecosystem
V8 is a very complex piece of software as it’s built with many parts as one would expect from a JavaScript engine: parser, AST, intermediate representation, bytecode interpreter, Just-in-time compiler, optimisers, etc.
Brief intro to the JIT compiler
Back then, JavaScript was purely an interpreted language, meaning that there would be some component within the engine that would dynamically translate the code into bytecode so that it could finally be executed.
Nowadays, it’s all about performance and making JavaScript faster, since it’s no longer just used to tinker with the graphical interface and modify a few HTML inputs by interacting with the DOM. It is now used in much more complex projects such as NodeJS in which via JavaScript we can have a full server running. Because of this, most JavaScript engines have implemented JIT compilers.
JIT compilers act dynamically while the JavaScript code itself is running. In essence, works on a very simple concept: If a function is used several times it will be considered a “hot” function, thus it will be compiled into machine code and, the next time the same function is called, the machine code will be run, skipping all the intermediate steps (intermediate representation, translation to bytecode, etc).
Ignition, TurboFan and Optimisation


Our point of focus is going to be on the interpreter and the optimising compiler. These in V8 come with the names of Ignition (takes the place of the baseline compiler but it’s also a bytecode interpreter) and TurboFan (one of V8’s optimising compilers), just as if it was a V8 engine.
Ignition will come after the parser, before any JavaScript is run as it is the responsible part for doing so. Its main function is to generate bytecode, and then feeding it all to the interpreter part of ignition to run it. One note to keep in mind is that before running the source code, there’s already been certain optimisations that have taken place, such as the elimination of dead code amongst others.
Turbofan is like the cooling system for the engine, the one that lowers the heat produced by Ignition. It will feed on the feedback provided by Ignition by inspecting things like, how many times a function has run, what are the types and values provided to that function, etc. With this, if any parts of the code are hot, Turbofan will compile the bytecode into machine code. So yes, you guessed it, Turbofan is the JIT compiler but with a small change: It optimises the code based on assumptions. This is why Turbofan is known (and targeted by exploits) for its speculative optimisations.
Towards quick optimisation, there’s an important concept related to what is known in V8 as built-ins. These are precompiled functions (either JavaScript, bytecode or assembly) that are known to be used in JavaScript very often for debugging purposes, so V8 has already a set of functionalities that can be called from the scripts themselves and will trigger the built-in code. Another way to find built-ins is to search for SimpleInstallFunction in V8’s source code.
All of the above forms part of a pipeline, which is where all the JavaScript code, bytecode and optimisations flow into machine code (gets optimised) or flows back into bytecode (gets deoptimised).
Turbolizer
I am really happy to see that big companies and world-class teams share their tooling to ease the debugging of pieces of software such as Turbofan. This is what Turbolizer is all about, a graphical interface that helps on the debugging of what happens on each optimisation phase when running our JavaScript code.
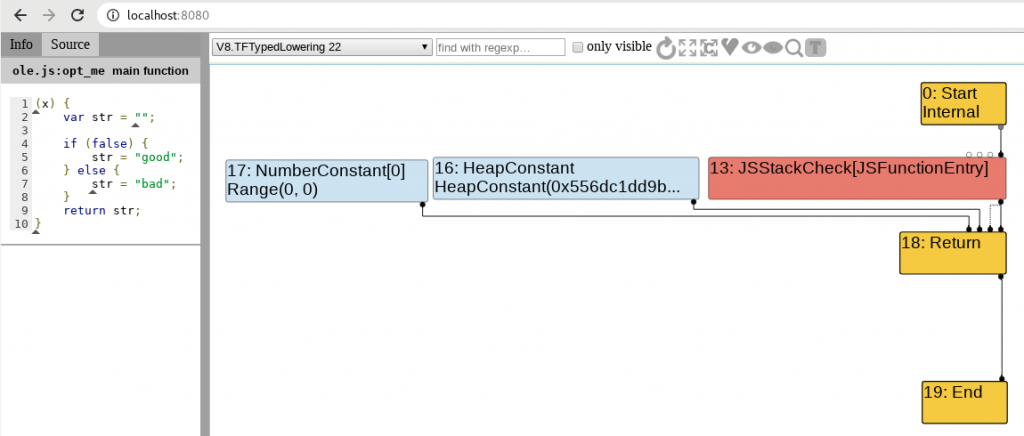
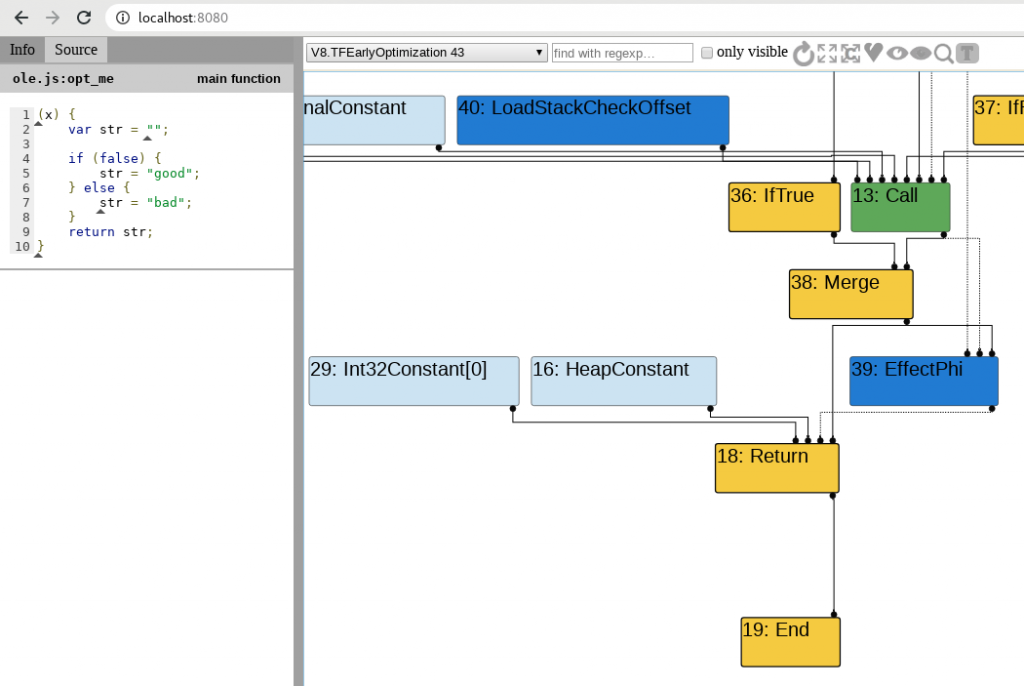
One too many colours
As you can see in the previous images, there are five colours in the representation given by Turbolizer on the different phases of optimisation. Since Turbofan uses the concept of “sea of nodes” which is a framework to aide on compilation optimisations. In our case, what’s important, is to know how this sea of nodes correlates to the JavaScript and to understand what happens on each phase with support from Turbolizer.
Nodes

Yellow: These nodes represent control nodes – anything that would change or describe the flow of a script like the starting or ending point, a return, “if” statement, etc. In my short experience with Turbolizer, looking at the “Return” node usually gives you a good overview of what’s happening with the function in terms of optimisation and assumptions from Turbofan.

Light Blue: A node representing a value that a certain node could have or return. Imagine that a function always returns “42”, we would see this as a constant or a range(42, 42) on the graph depending on the optimisation phase.

Dark Blue: Representation of the Intermediate Language actions (think bytecode instructions). Helpful on knowing from where the feedback is being consumed into Turbofan.

Red: This is the underlying JavaScript code that is executed or actions at JavaScript level. For example JSEqual, JSToBoolean, etc.
Green: Machine level language. Everything that is at a lower level. Examples of operations and identifiers for Machine level language on V8 Turbolizer can be found here.
Please note that these might not be totally accurate descriptions as all the documentation/blogs I found about it were the following links and looking up V8’s source code:
Turbofan Optimisation
Finally! We got there! As mentioned above, Turbofan does several optimisation passes, and many optimisation phases can be exploited via type confusion bugs. If we check on Turbolizer, we see that there are around 20 phases:

The exploitation process is out of the scope of this blog post but in case you want to dig deeper, the few ways that I know how to exploit these are by creating arbitrary read/write primitives via usage/corruption of a DataView object or heap-spraying and then abusing Out-of-Bounds read/write to identify victim objects to corrupt pointers within an object (the pattern is always corrupting a set of object properties to have the aforementioned read/write primitives).
Where to start looking
Since we have compiled v8 in debug mode, this section will start with the analysis on Turbolizer of one of the most common nodes to look for and will end with a bit of debugging. One thing to keep in mind is that we need to run gdb where the d8 binary is located, so that it loads the source code properly and we don’t have to fiddle with the dir command in gdb.
As mentioned before in the little note about exploitation, one of the ways is Out-of-bounds read/write and because of this, we’ll go ahead with a JavaScript example that disables the out-of-bounds array access check. In case you want to dive into much fine grain details, this post covers Turbofan, the exploitation of disabling such check and V8’s responsible code in much deeper detail than here, but note that it’s a bit outdated (which is usual on browser exploitation) as the code has changed.
let arr = [1.1, 2.2, 3.3];

function nochecks(pos){
    let mod = 2;
    var access = arr[pos] % mod;
    return access;
}

nochecks(10);
for (let i = 0; i < 10000; i++)
    nochecks(i);
nochecks(10);
We can see there's a nochecks function that takes a pos variable as argument. Afterwards the modulo 2 of pos is calculated and used to access a position in the arr array, effectively impeding numbers higher than 1. With this, up until when the latest V8 hardening was implemented, one of the common things to go look for was to see if the optimiser has removed bounds checking. For this task, there are two things that have helped me through the analysis. One is the trace flag of d8:

One very valuable flag is --trace-turbo-reduction as it will give us the verbose traces of all the reductions made on the code on each optimisation phase associated to reducing the code. From an exploit development angle, reductions are most of the time assumptions from the compiler, which will be a point of focus towards abusing the optimisation.
So, if we run the previous JavaScript snippet with the following command:
./v8/out/x64.debug/d8 --trace-turbo-reduction --trace-turbo javascript_tests/nochecks.js
We are going to get the aforementioned optimisation traces and because we will be using Turbolizer afterwards, the --trace-turbo flag will help us generate a .json file that later can be fed into Turbolizer for analysis. As we can see and expect, the optimiser has found that we are accessing an array and thus, inserts CheckBound nodes:
./v8/out/x64.debug/d8 --trace-turbo-reduction --trace-turbo javascript_tests/nochecks.js | grep -i bound

This data can then be observed within Turbolizer, which will help in analysing the behaviour, depending on the sea of nodes that are generated. Let's, for example, observe the CheckBounds node within the LoadElimination phase on Turbolizer. For this, we open the generated turbo-nochecks-0.json file, and then select the adequate optimisation phase:
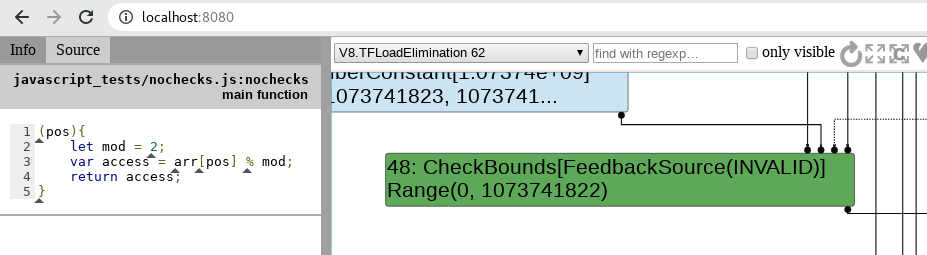
With this, we can continue our analysis by inspecting what other components in the optimiser are interacting with the CheckBounds node.
As mentioned before, we'll finish this section and blog post with a simple debugging session, just to show the hardening implemented by v8 in the case of CheckBounds. For this, in the source code, we look for the VisitCheckBounds function in the simplified-lowering.cc file and place a breakpoint on the first if line (run d8 once before placing the breakpoint or it won't work):

if of VisitCheckBounds functionIf we continue debugging, we'll see that the optimiser visits the node, yet does nothing. We are not interested in this since there is no lowering (assuming the node) being done. To get to the lowering phase, type c in the debugger and then, type p lower(). The lower function returns true if Turbofan is acting on a lowering phase. Therefore, when we see our command returning 0x1 it's when we wan't to continue debugging and see line by line what's happening. In previous versions of the code, we would expect a function to be called, DeferReplacement which would eliminate the bounds checking (this is shown on the exploitation references mentioned previously). Let's see what we find now:

VisitCheckBoundsWhat a bummer! There is no elimination of bounds checking anymore. What we'll see if we inspect further is that v8 has now implemented certain hardening that will either de-optimise the code or straight abort when trying to access out-of-bounds on the array. Yikes! What an ending!
Note: There are still cases in which bound checking is still removed. More information on this blog post by Jeremy Fetiveau.
Conclusion
If it wasn't because of all the resources out there (linked throughout the blog post in the relevant parts) and the amazing tooling and well-written code by the people at v8, it would have been a nightmare to study. As a fallback, ultimately only trust the code/assembly you're targeting, regardless of how many resources out there.
Finally, we can see that browser development goes too fast, like very fast, and because of this, browser exploitation goes obsolete in just a few months, making it a real cat and the mouse race to actually get exploits going, but definitely rewarding, if just for the knowledge.
If there is any glaring mistakes/typos/whatevers or you have any further doubts do not hesitate sending an email to javier [at] the domain of this website.