TL;DR In this blog I want to show you how useful frida-trace can be at hooking thousands of methods at a time. I also wrote some scripts for improving its output a bit.
I often find that half of the problem is finding out what you don’t know. Take a mobile application for instance:
- Which class is responsible for the SSL pinning?
- Which class does the crypto?
- What method is used to retrieve data from the local storage?
Once you have enough information, life becomes a lot easier. Unfortunately, finding this information can be difficult – especially when the mobile application you’ve been given is obfuscated beyond recognition, and the client refuses to provide you the original version, or the source code.
I’ve recently found myself in this situation a couple of times and found that frida-trace can be quite useful.
As the name implies, frida-trace allows you to trace the execution flow of an application. It does this by hooking the functions used by the application and outputting the functions’ input parameters and its return value.
The syntax required to hook methods is fairly straight forward – for Java use the lower case -j flag along with the class name and method name. You need to separate the class name and method name with an exclamation mark, much like the Windows syntax of old. You can hook constructors with the $init method.
For instance, if you want to trace the constructor of the javax.crypto.Cipher class you can use the syntax:
frida-trace -U -f com.not.another.mobile.app -j 'javax.crypto.Cipher!$init'The -f flag will tell frida-trace to spawn the app, and then hook it, which might not always work because the class loader hasn’t gotten around to loading the target class yet. In such a case, you will see the output:
Started tracing 0 functions.One way around this is to first start the app manually, and then find its pid using
frida-ps -UYou can then attach frida-trace using the -p flag, e.g.
frida-trace -U -p 12345 -j 'javax.crypto.Cipher!$init'So far, you could also have used plain frida and a typical frida hooking script to obtain the same result as the above frida-trace commands.
Where frida-trace really shines however, is its ability to inject hooks into thousands of functions at the same time, allowing you to search for specific output or behaviour.
To do this, you can make use of the * wildcard operator to hook multiple classes and methods.
For instance, if you want to quickly see all the JSON processed by an app, without even turning on Burp, you can use the following frida-trace command.
frida-trace -U -p 12345 -j '*json*!*' -j '*JSON*!*'In this case I’m specifying a wildcard in the -j flag to match any class whose name contains the word json in it, i.e the *json* part. I then add in an ! which is used to separate the method names from class names, and then finally specify a * to match all method names. I also include an uppercase version of the -j flag, since the matches are case sensitive.
Similarly, if you want to see all SQL statements made by the app, you can use
frida-trace -U -p 12345 -j '*SQL*!*' -j '*sql*!*'This approach is incredibly useful to quickly find out what an application does in the background.
Undoubtedly, when tracing hundreds of methods, one or two may spam useless output every second, making it hard to spot things you are interested in. Hooking some methods may also slow the application down to a crawl or worse, cause a crash. You can exclude these methods and classes by using the upper case -J flag, which has similar syntax to its lower-case version. Make sure to add the -J flag after the -j flag. For instance
frida-trace -U -p 12345 -j '*SQL*!*' -j '*sql*!*' -J '*ProblemSQLClass*!*'or
frida-trace -U -p 12345 -j '*SQL*!*' -j '*sql*!*' -J '*sql*!ProblemMethod'While very useful, frida-trace is a bit of an unpolished diamond in its original state, since its default output is pretty confusing and not always helpful.
For instance, by default frida-trace will indent its output each time one traced method calls another traced method, so that the user can understand the flow of the application.
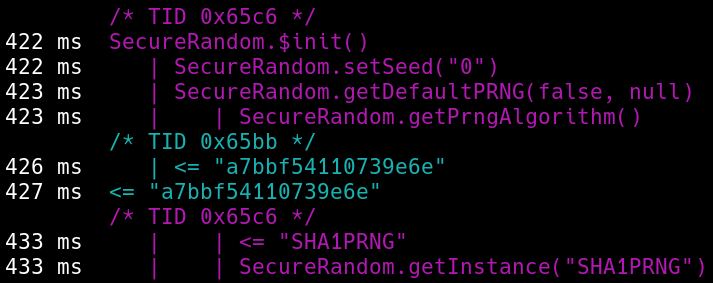
While this idea make sense when you are dealing with one or three levels of nested calls, it quickly becomes a problem in Android mobile applications where 20 nested calls isn’t uncommon.
To solve this problem is easy enough – find the line in frida-trace’s tracer.py containing the word indent and modify it so that it no longer appends a space for each depth.
Change this:
def on_trace_events(self, events) -> None:
    no_attributes = Style.RESET_ALL
    for timestamp, thread_id, depth, message in events:
        if self._output is not None:
           self._output.append(message + "\n")
        elif self._quiet:
           self._print(message)
        else:
           indent = depth * "   | "
           attributes = self._get_attributes(thread_id)
                    if thread_id != self._last_event_tid:
To this:
def on_trace_events(self, events) -> None:
    no_attributes = Style.RESET_ALL
    for timestamp, thread_id, depth, message in events:
        if self._output is not None:
           self._output.append(message + "\n")
        elif self._quiet:
           self._print(message)
        else:
           indent = ""
           attributes = self._get_attributes(thread_id)
                    if thread_id != self._last_event_tid:
The next issue to solve is how frida-trace outputs functions’ input parameters and return values. For basic types, such as strings, integers and so forth, it does a fine enough job. The same cannot be said for objects.
Consider for instance the humble Java byte array object, i.e. a byte[] object. In some cases, frida-trace will make use of the toString method to obtain the byte array’s string representation, only to return an unhelpful string along the lines of [B@d2c77a1.
In other cases, frida-trace outputs the individual bytes of a byte array; however, it displays them as signed bytes, causing several entries to be shown as negative values. It will also show the complete content of a byte array – this can cause a torrent of bytes to be displayed, as buffers are often hundreds to thousands of bytes large. More importantly, it will only display the content as bytes – even if the bytes could be represented in a more meaning full manner, such as legible text.
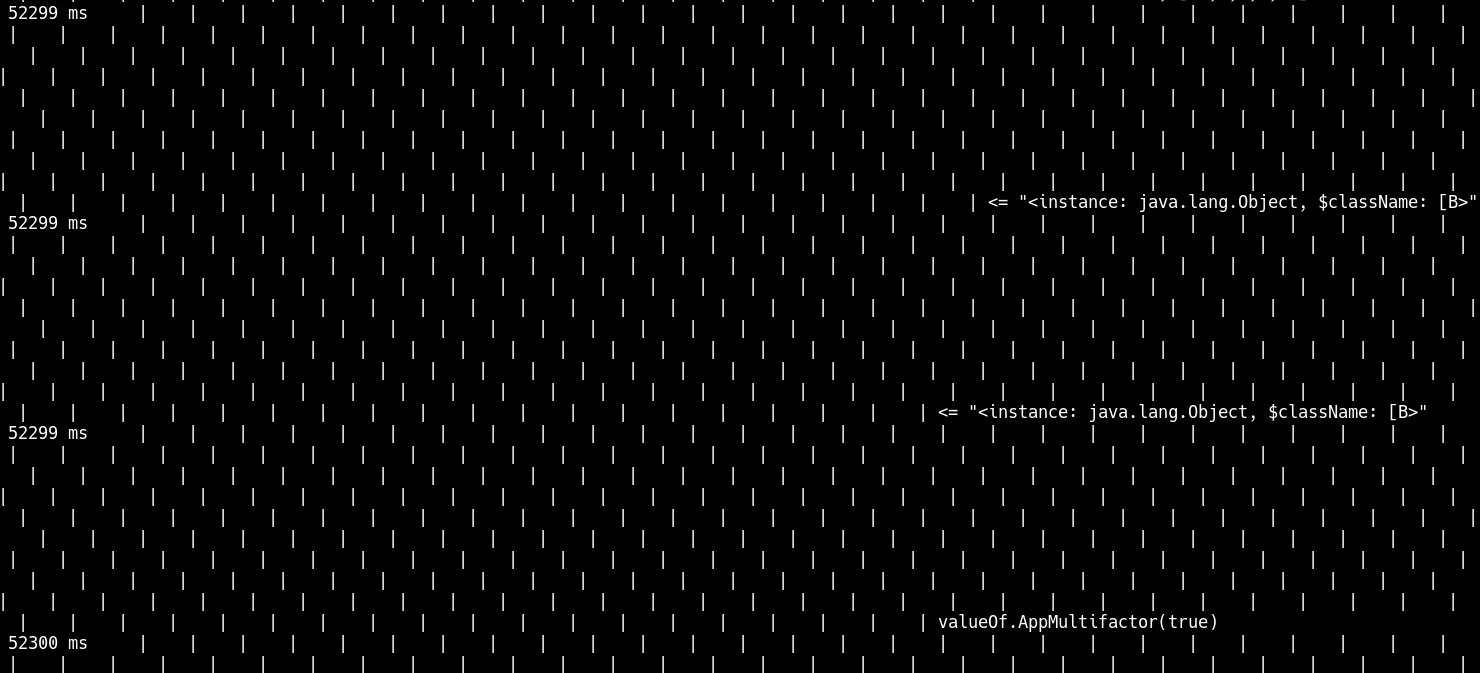
Furthermore, the content of collection objects like java.util.Vector are not shown – instead frida-trace will only output something like
<instance: java.lang.Object, $className: java.util.Vector>This happens with quite a lot of objects, such as SecretKeySpec which frida-trace represents as
<instance: java.security.Key, $className: javax.crypto.spec.SecretKeySpec>It would instead be much more useful to print the encryption key’s bytes using SecretKeySpec.getEncoded().
With these issues in mind, I set out to modify the behavior of frida-trace to be a bit more useful.
The first time frida-trace is told to hook a method, it creates a Frida script for it, which it calls a handler script. These handler scripts are stored in the __handlers__ folder of the current directory. If a handler script already exists for a method, frida-trace will use it instead of creating a new one. The idea here is that users are able to modify the handler scripts for each method, so that they can customise what frida-trace does when it hooks it.
This provides users with extreme granular control over what frida-trace does when hooking method calls. Don’t like the way frida-trace outputs the input arguments or return value of a specific method? Simply modify its corresponding handler script.
While this sounds great in theory, modifying thousands of handler scripts to make sure that all byte[] objects passed as input arguments or return values are properly displayed is impractical.
Furthermore, I couldn’t find a nice way, using frida-trace, to overwrite the behaviour of the toString method of certain objects, such as byte[] or javax.crypto.spec.SecretKeySpec. I’m sure there is a way – I’m still looking.
So instead, I decided to modify the default Java handler script, whose content is used to create the initial handler scripts for each method that is hooked by frida-trace.
To do this, I modified tracer.py and commented out the default hard-coded Java handler script and replaced it with logic that would instead load the default handler script from a file in my home directory. The modifications looked like this:
def _create_stub_java_handler(self, target: TraceTarget, decorate) -> str:
       lines= "".join([l for l in open("~/template_trace.js")])
       lines= lines.replace('display_name',target.display_name)
       return lines
This made it far easier to modify the default handler script, and also allowed me to swap around different scripts by using a symlink. If I wanted to change to another handler script, I would recreate the symlink, which was always named template_trace.js. With this setup, keep in mind to remove the __handlers__ folder each time you modify your default handler script. An alternative idea is to include an argument into frida-trace, that provides a path to the default handler script that should be used.
Handler scripts have two functions – one called onEnter which executes at the start of the hooked method, and outputs the parameters passed to it, and one called onLeave that executes at the end of the hooked method and outputs its return value. The default handler script looks like this:
/*
 * Auto-generated by Frida. Please modify to match the signature of %(display_name)s.
 *
 * For full API reference, see: https://frida.re/docs/javascript-api/
 */

{
  /**
   * Called synchronously when about to call %(display_name)s.
   *
   * @this {object} - The Java class or instance.
   * @param {function} log - Call this function with a string to be presented to the user.
   * @param {array} args - Java method arguments.
   * @param {object} state - Object allowing you to keep state across function calls.
   */
  onEnter(log, args, state) {
    log(`%(display_name)s(${args.map(JSON.stringify).join(', ')})`);
  },

  /**
   * Called synchronously when about to return from %(display_name)s.
   *
   * See onEnter for details.
   *
   * @this {object} - The Java class or instance.
   * @param {function} log - Call this function with a string to be presented to the user.
   * @param {NativePointer} retval - Return value.
   * @param {object} state - Object allowing you to keep state across function calls.
   */
  onLeave(log, retval, state) {
    if (retval !== undefined) {
      log(`<= ${JSON.stringify(retval)}`);
    }
  }
}
The handler scripts are parsed and executed by frida-trace’s agent as callbacks. This logic is implemented in the agent’s code in tracer_agent.js.
At a high level, I wanted a function that would intelligently print out arguments and return values for any provided object or primitive type – or at least the ones that I was interested in. I would then call the function within the default handler script’s onEnter or onLeave functions to obtain a useful string representation for each of the arguments and return values.
However, I didn’t want to define this inside the default handler script, as this would mean that each time a traced method’s onEnter or onLeave occurs, the function would be redefined. This could slow down the application, especially when tracing thousands of methods.
I instead placed the function in a static class called betterPrint at the top of the tracer_agent.js file, so that it would only be loaded once when the agent initially executes, and so that its methods would be accessible in the onEnter or onLeave handler script callbacks.
I named the function getPrettyOutput, and modified the default handler script’s onEnter function to call the getPrettyOutput on each argument, and provide the concatenated result as the function’s output. The onLeave function was similarly coded.
{
        onEnter(log, args, state)
        {

            var prettyArr=[];
            for (let i=0; i< args.length; i++)
            {
                prettyArr[i]=betterPrint.getPrettyOutput(args[i]);
            }
            var output=prettyArr.join(', ');
            if (output != "") { log(`display_name args: ( ${output} )`)};
        },

    onLeave(log, retval, state)
    {
        if (retval !== undefined && retval !== null)
        {
            var prettyRet=betterPrint.getPrettyOutput(retval);
            if (prettyRet!=="") { log(`display_name ret: ${prettyRet}`)};
        }
    }

}
Internally, getPrettyOutput was a convenience function that called two other functions in its class, getType and processType, to obtain an objects’ string representation.
As the name suggests, the getType function’s goal was to determine the type of variable. If the world was a nice place, this would have been an easy task, and you could just call the handy getClass method on the variable and be done with it. However, it turns out that in frida sometimes objects’ aren’t fully resolved, and the getClass method doesn’t exist. In these cases, you can use the Object.getOwnPropertyNames JavaScript function on the object to get a list of available methods and variables.
One of the variables that the objects almost always expose is $h, which is frida’s internal handle to the object. After searching the frida code base for a while, I found out that you could use this handle along with the Java.vm.getEnv().getObjectClassName method to obtain an object’s internal class name.
If $h isn’t available, we can make use of the built in JavaScript function typeof, which will at least tell us if the variable is an object, a JavaScript string, or perhaps a primitive type like a number.
Once the getType function determined the type of a variable, either by the getObjectClassName or typeof function, it would return it.
This gives us the following code for getType:
  static getType(val)
  {
        if (val=== undefined || val === null)
        {
          return "null";
        }


        const env = Java.vm.getEnv();
        var handle = val.$h;

        var type;
        if (handle !== undefined)
        {
          type =env.getObjectClassName(handle);
        }
        else
        {
          type =typeof val;
        }

        return type;
  }
Next up, is the processType function, which takes in a variable and its type as determined by getType. It then uses the type to determine which function to call to obtain the variable’s prettified output.
For instance, if the value was a byte array, the processByteArr function would be called, which I coded to return a string containing the length of the byte array, its first few bytes, and also its ASCII representation if possible.
I wrote similar functions to process other classes, such as processCharArr which would output the content of a char [] array as a string, and processVector which would recursively call processType on each object contained within a Vector, so that all its objects are displayed.
I also wrote a catchall – if the type wasn’t processed by any function, it would be cast as a java.lang.Object. The casted object’s toString method would then be used to obtain a string representation of the object. This got rid of all the unresolved frida objects, which gave output like:
<instance: java.lang.String, $className: java.util.String>The full betterPrint class looks something like this:
class betterPrint {

  static getPrettyOutput(val)
  {
    return betterPrint.processType(betterPrint.getType(val),val);
  }

  static getType(val)
  {
        if (val=== undefined || val === null)
        {
          return "null";
        }


        const env = Java.vm.getEnv();
        var handle = val.$h;

        var type;
        if (handle !== undefined)
        {
          type =env.getObjectClassName(handle);
        }
        else
        {
          type =typeof val;
        }

        return type;
  }

  static processCharArr(arrVal)
  {
    var output="";
    Java.performNow(() => {
      arr=Java.array('char',arrVal);
    });

    if (arr.length==='undefined')
    {return "undefined char array";}
    for (let i = 0; i < arr.length; i++)
    {
      output+=arr[i];
    }
    return `CharArr: ${output}`;

  }

  static processByteArr(arrVal)
  {
      var arr;
      Java.performNow(() => {
        arr=Java.array('byte',arrVal);
      });

      if (arr.length==='undefined')
      {return "undefined byte array";}

      var printOnlyBytes=false;
      var bytesAdded=0;
      const maxBytesToShow=100;
      var byteResult =  "";
      var asciiResult = "";

      for (let i = 0; i < arr.length; i++)
      {
        val= arr[i] & 0xff;
        var chr="";
        if ((val > 31) && (val < 126))
        {
          chr += String.fromCharCode(val);
        }
        else
        {
          printOnlyBytes=true;
        }
        asciiResult+=chr;
        bytesAdded+=1;
        if (bytesAdded < maxBytesToShow)
        { byteResult+=val+","; }
      }

      if (printOnlyBytes)
      { return `bytes: [ ${byteResult} ] ascii:[ ${asciiResult} ] (${arr.length} bytes)` ;}

      else

      { return `ascii:[ ${asciiResult} ] (${arr.length} bytes)` ;}
  }

  static processVector(vec)
  {
    var vectorOutput="[";
    Java.performNow(() => {
      const vector = Java.cast(vec,Java.use('java.util.Vector'));
      for (let i=0; i<vector.size(); i++)
      {
        type=betterPrint.getType(vector.get(i));
        vectorOutput+=betterPrint.processType(type,vector.get(i));
        if (i<vector.size()-1)
          vectorOutput+=",";
      }
    });
    vectorOutput+=']';
    return vectorOutput;
  }


  static processType(type,value)
  {
        var prettyRet=""
        var typeArr=["null","undefined","boolean","number","bigint","string","symbol","function","object"];
        if ((typeArr.indexOf(type) > -1))
        {
          prettyRet+=value;
        }
        else if (type==='[B')
        {
          prettyRet+=betterPrint.processByteArr(value);
        }
        else if (type==='[C')
        {
          prettyRet+=betterPrint.processCharArr(value);
        }
        else if (type==='java.util.Vector')
        {
          prettyRet+=betterPrint.processVector(value);
        }
        else
        {
          Java.performNow(() => {
            const object = Java.cast(value,Java.use('java.lang.Object'));
            prettyRet+=object.toString();
          });
        }
        return type+"->("+prettyRet+");"
  }
}
You can easily extend this code to provide a proper string representation for a class you’re interested in, by adding in a method that would process an object of that class and provide the desired output, as well as an if statement in the processType method to match that class.
After putting this all together, I was able to use frida-trace to hook thousands of methods and obtain understandable output. I especially found the ability to view the content of byte arrays as ASCII text super useful.
In a recent mobile application test, I used this approach to figure out which obfuscated classes did what. I simply hooked all of them (they were under one package), and then spied on the input arguments and return values going back and forth, until I had a fair idea what some of the obfuscated classes and methods did.
I hope this blog about frida-trace helps you in reverse engineering your next mobile application.