The end of the year is getting closer, fast, so I figured it was a perfect time to talk about my side project from last year. In this post I want to walk you through setting up a Raspberry Pi as a home server with all of your services running in docker containers with valid Let’s Encrypt certificates without exposing the Pi to the Internet. We will be setting up a myriad of services such as Pihole, SmokePing and Grafana as well as WireGuard for remote access, so buckle up!

table of contents
This is a rather large post, so here is a ToC to try and navigate it.
In part 1, I’ll cover the base setup.
In part 2, I’ll cover customisations I have made.
pi hardware & software
I don’t want to write yet another Pi hardware / software setup how-to. If you need help with that, for reals, Google has plenty of resources. If you are looking for posts where you can use small embedded hardware like a Pi as an attack toolkit, have a look at Rogan‘s blog posts here and here.
What you will read in this post was all built on the Pi4 model B with 4GB of ram. Software-wise, the Pi was running Pi OS (formerly called Raspbian). I just dd‘d the OS image to an SD card and booted the Pi. Realistically nothing here is tied to a Pi; you can do all of this in a plain Linux VM too!
Ironically it wasn’t long after I built this that I broke the OS in a way that I had to reflash the SD card. The beauty of the setup you are about to read about is that should that happen to you, you can basically just git clone a repo and be up and running in a few moments again.
base software
I wanted as little as possible installed on the Pi’s host OS. If it could run in a docker container, that’s where I will try and run it. Of course some host software installation is inevitable, such as docker itself. I configured all services using docker-compose files so that would need installation as well. In short, apt install docker.io docker-compose and you should be good.
service architecture
Before diving into the details, let’s talk about the target architecture for a moment. Many of the services I wanted to use have web interfaces, ie. Smokeping, Grafana etc. Naturally these will be served from the Pi, but I don’t want them to be served under sub-directories on a web server. Instead, I’d like something like service.domain.com for each service I am hosting (aka virtual hosting). I also wanted these services to have valid TLS certificates (even though they were internal only), so I opted to use an external domain I own and add a subdomain called internal. This will require some DNS tweaking, but we will get to that in a bit. Yes, I could absolutely use something like nginx for this, but c’mon, its 2020.
arm docker images
When setting up services on a Pi, you may quickly notice that not all docker images on Dockerhub have ARM architecture support. This is not always a problem and sometimes finding one that supports ARM is just a little bit of googling away. But, when you run into it its good to know that you can use docker-compose to automatically build a local image based on a remote Dockerfile. For example, instead of specifying the image tag as image: leonjza/trauth which will pull the image from Dockerhub, you may also do this to build it locally:
trauth:
  build:
    context: https://github.com/leonjza/trauth.git
    dockerfile: Dockerfile
  image: trauth:local
services setup
I chose to use docker-compose files as it allows me to easily tie together relevant and related services to each other. It also makes it super simple to have always on services with the restart: tag. If your Pi lost power or rebooted for some reason, then the compose stacks will all start up again without manual intervention. My general workflow is to have a separate folder for each set of related services inside of a larger parent docker-apps folder.
smokeping
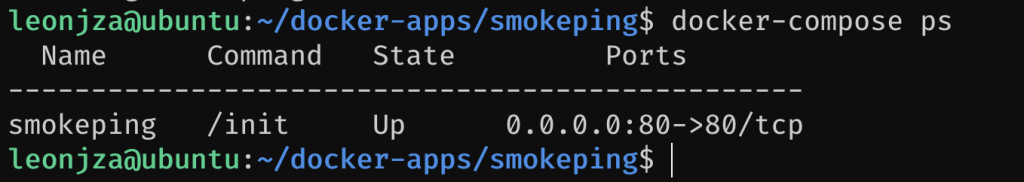
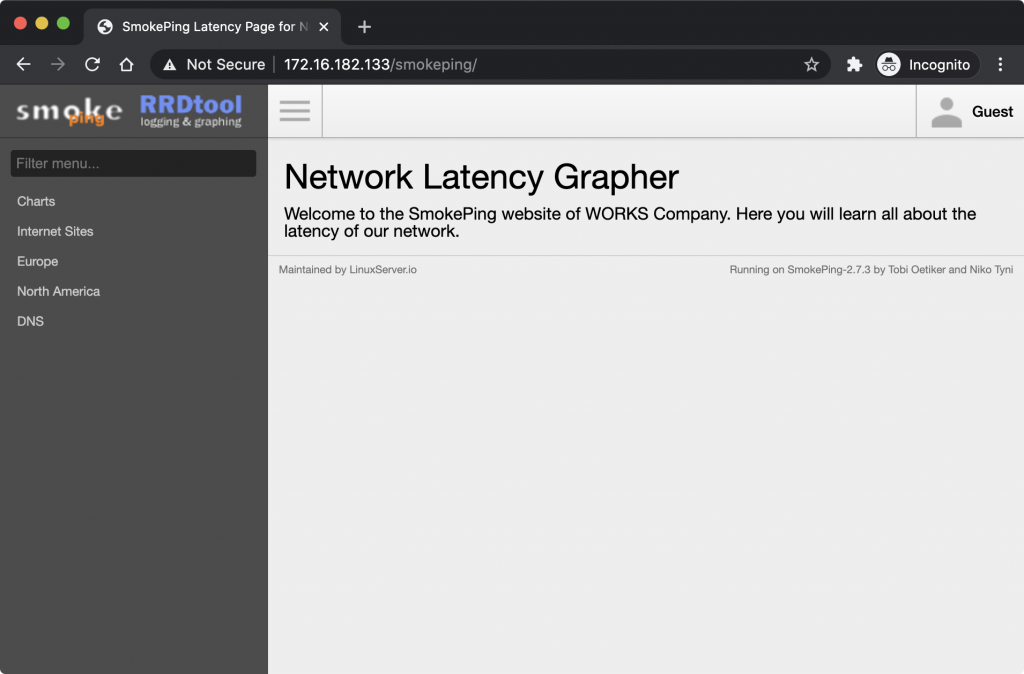
Before doing anything fancy, let’s start with a super simple service we may want to configure, like smokeping. With docker we can deploy apps with almost zero knowledge of the apps internals. The Dockerhub page for smokeping has a sample docker-compose schema, so just copy that to a file, say docker-apps/smokeping/docker-compose.yml and paste the contents. Next, run docker-compose up -d and you should have smokeping available on the IP address of your Pi. Of course, you may want to configure smokeping with some Targets, but lets just focus on the web service for now.
netdata
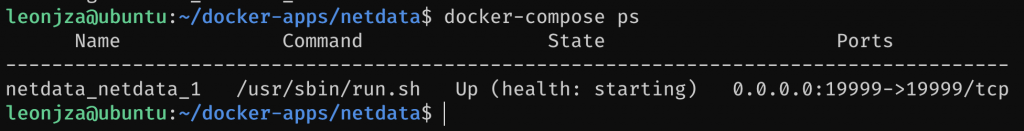
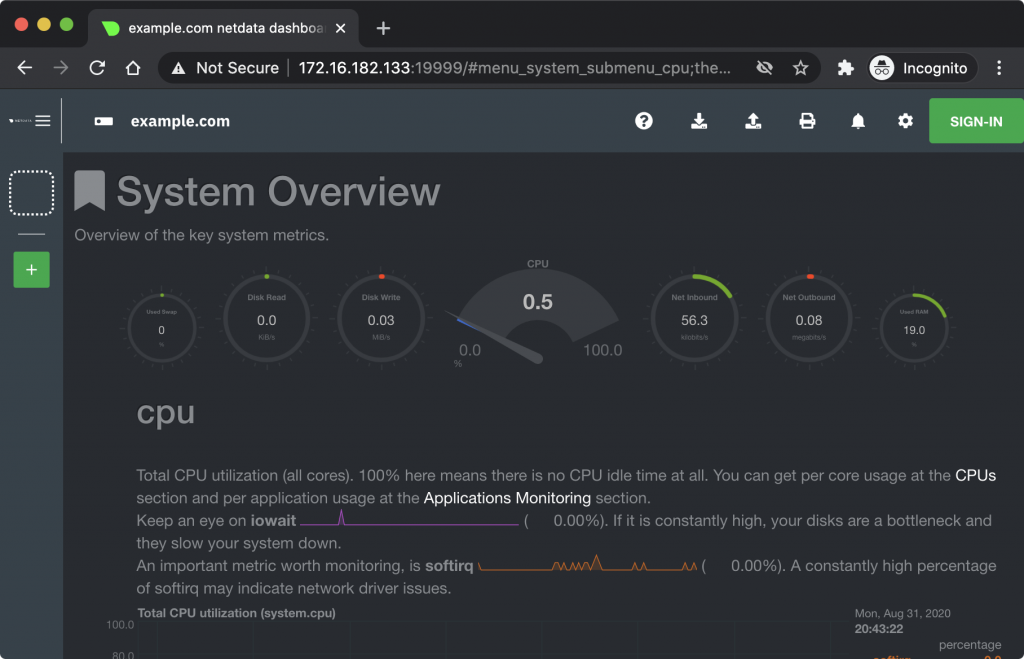
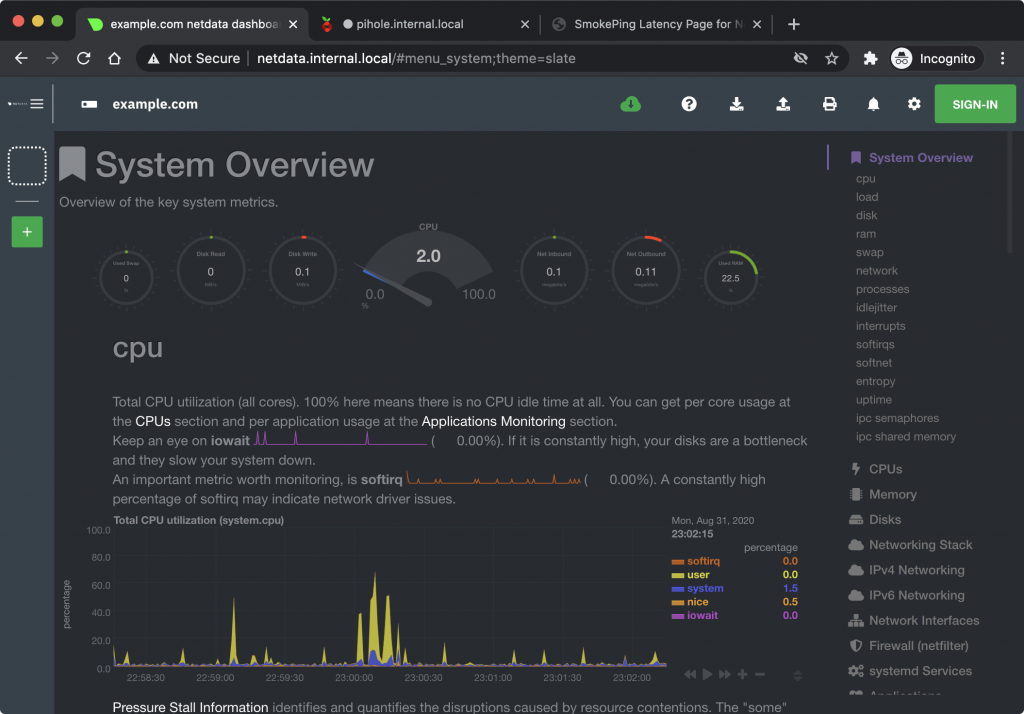
Getting smokeping up and running was really easy. But now imagine you wanted to get another service running. Say something like netdata. Again, the Dockerhub page has a sample docker-compose schema we can use, so copy and paste that into a file say at docker-apps/netdata/docker-compose.yml. Finally, docker-compose up -d and netdata should be available on port 19999 on the IP address of the Pi.
Again, hardly any work or knowledge of the internals of these apps but we could get them up and running in no time. So far though, we have one app taking up port 80, and another taking up 19999. They don’t clash, yet.
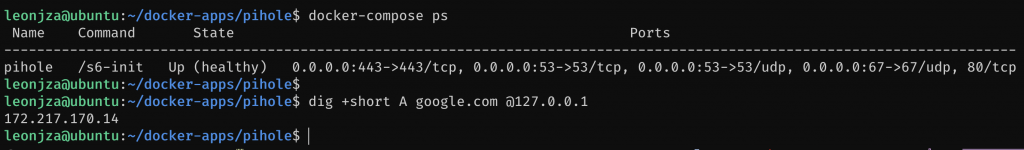
pihole
The third service we will get getting up and running will be pihole. Just like smokeping and netdata, the pihole Dockerhub page also has a sample docker-compose schema. Like before, dump it to a file at say docker-apps/pihole/docker-compose.yml. The first thing that should catch your eye is the ports tag in the compose file.

As far as ports 53,67 and 443 go, they are not in use yet, so assigning those to the pihole service won’t be a problem. But port 80 is already in use by smokeping, so what are our options here? Well, we could:
- Make the pihole web interface available on another port, say port 81 with a port mapping such as
"81:80", meaning the host will forward port 81 traffic to port 80 on the container. (eew) - Add a web server such as nginx on the host OS to reverse proxy to the relevant docker services. This could be done either using subdirectories or maybe using virtual hosting to reach the relevant backend service. In this config you will have both the docker services ports and nginx open on the host. (also eew)
- Add a dockerized web server to perform the same as the above, but instead of opening ports on the host for each service (like we have done so far) you can reach containers by their service name if they are in the same docker network as the nginx container (we have not configured this yet). This way you will only have to open port 80 on the host for the nginx service (less eew, but still eew)
- Or…. use Traefik and docker networks (not eww, no, in fact, yum! very yum!)
To wrap up the pihole setup for now (we’ll get back to this), just comment out the port 80 mapping so that the line looks like this:
ports:
  - "53:53/tcp"
  - "53:53/udp"
  - "67:67/udp"
  #- "80:80/tcp"
  - "443:443/tcp"
The last thing before you do a docker-compose up will be to disable and stop the systemd-resolved daemon with systemctl disable --now systemd-resolved. This way your pihole won’t fail to start up because 53/udp is already in use.
traefik
full disclosure: i am a massive traefik fan.
In case you have not heard of it, Traefik is a cloud native reverse proxy with some pretty neat features which we will be using extensively. Not only does it support HTTP, but TCP and UDP too. Once Traefik is configured, we can at any time add a new service with some labels which would result in Traefik automatically discovering the new service, configuring a web route to it and (optionally) setting up the TLS certificate for it. So in a few moments from issuing a docker-compose up command, we will be able to browse to a new-service.internal.domain.com domain and have it present a valid certificate!
Written in Golang, Traefik comes in many forms which include a standalone binary as well as a docker image. We are going to use the docker image here.
traefik – intro
Traefik is seriously powerful, and it shows in the myriad of ways you can configure it. The documentation site has a whole section dedicated to configuration discovery. The part we are going to be interested in is the docker configuration discovery feature (I want to encourage you to have a look at the many others that exist). In a nutshell, what docker configuration discovery means is that by attaching labels to our docker-compose services, we can instruct Traefik how to reach the web interfaces available in our service, both from an external route and internal service perspective. This after some once-off Traefik specific configuration is done to enable docker configuration discovery. If none of that makes sense yet, don’t worry, we are going to look at numerous examples and then some.
traefik – http concepts
There are various ways in which HTTP services can be configured with Traefik. Since we’re focusing on Docker, the following image from the Traefik documentation aims to visualise what some configuration setups may look like.

Essentially, you need to know about two concepts. Routing, and services. A route connects to a service. A route can be a full hostname, a wildcard, a path, both, a request with a specific header, a request with a specific query string or a complex regular expression, but there are many more combinations possible. These routes need to be told that when matched, which Docker service (or services in a load balanced scenario) the request should be routed to. For more detailed examples of routing rules, see the documentation here.
For our purposes, we are just going to use simple host-based routes like smokeping.internal.domain.com. This in turn will be mapped directly to the target service which is smokeping in this case.
treafik – configuration
We have established that we want to use the Docker configuration discovery feature and that we are going to be running the Traefik container. So, get the example docker-compose schema from the Traefik website here and save it in a file say at docker-apps/traefik/docker-compose.yml. Notice how the Traefik service gets access to the Docker socket; this is how it knows whats going on.
With the example compose schema saved, we can now make some tweaks. To test, we will first just get the example compose file running. In our case, the smokeping service is already binding to port 80 (kinda what lead us down this rabbit hole in the first place, right), so for now just stop that service with docker-compose down in the docker-app/smokeping folder.
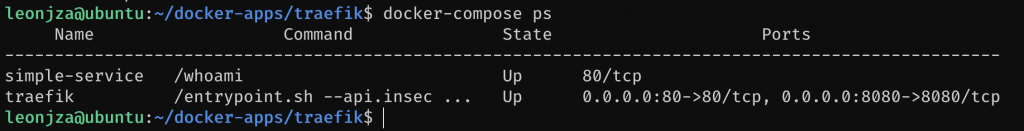
Next we will edit the example Traefik compose file, updating the example whoami service with a new hostname. This is the first place where you will see the route -> service binding in action. By default, the whoami service will instruct Traefik (using labels) that requests for whoami.localhost should be routed to the whoami service. It also tells Traefik that it will accept requests from the web entrypoint which is defined in the traefik service’s command stanza.
For our testing purposes, this service will not be on localhost but instead on our pi, so edit the Host() rule to whoami.local. Once done, docker-compose up -d !
If you having trouble with DNS at this stage, stop pihole and start the systemd-resolved again, for now.

Next, add a quick hack to your computers local /etc/hosts file, pointing whoami.local to the IP address of your Pi. When that is done (and the Traefik stack is up), you should be able to browse to http://whoami.local/.
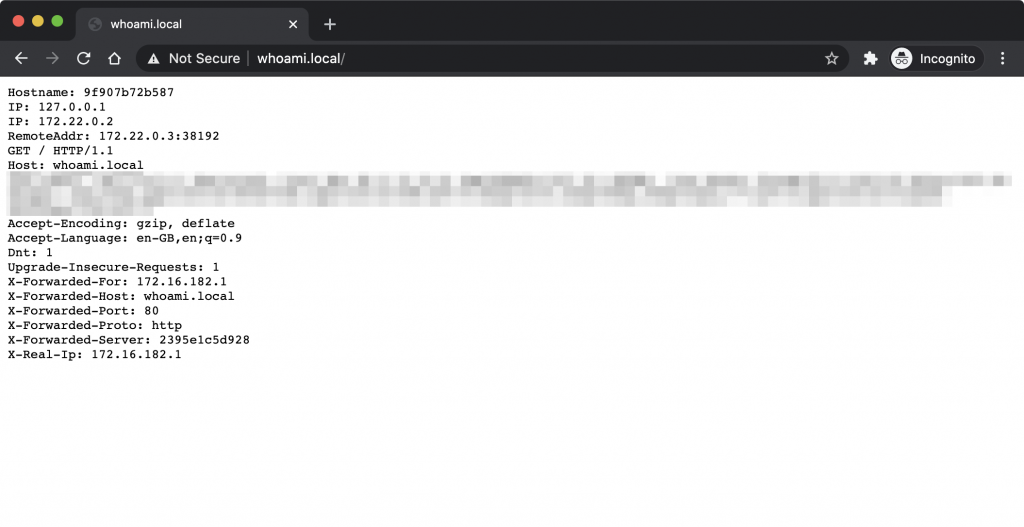
What you should see here is that the whoami service is fronted using Traefik (note how simple-service has no external port binding). In terms of Traefik basics, thats it! Let’s go and glue together the services we already set up in the previous steps to Traefik. You can safely remove the example whoami service from the docker-compose.yml file and cleanup the temp /etc/hosts hack.
traefik – routing smokeping
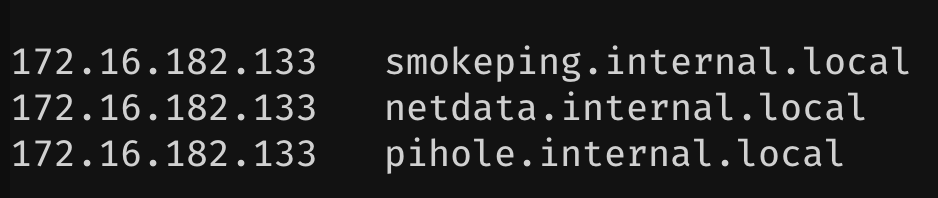
We have seen how the example whoami service was glued together, so lets do the same thing for smokeping. We will talk about DNS a little bit later in this guide, so for now add a new hack to your local /etc/hosts file for smokeping.internal.local, pointing to your Pi’s address.
The next thing we need to talk about is a little bit of docker networking. In order for Traefik to be able to reverse proxy to services, it needs to have network access to them. We have been creating services using separate docker-compose.yml files in different folders. When you start those services up without a network tag, docker-compose will go and create a new docker network specific for that stack. Usually, its the folder name with the _default suffix. In the following image you will see the netdata and traefik default networks.
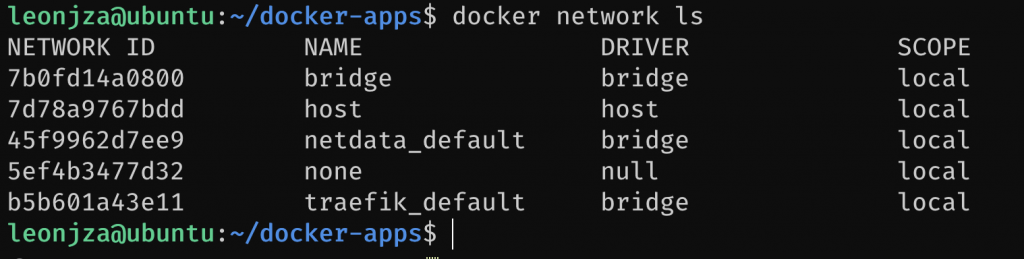
The problem with this configuration is that because these two services are using different docker networks, they are effectively “isolated” from each other and as a result, Traefik won’t be able to reach them. When we configured the whoami service earlier, it was in the same network as the traefik service (because they were in the same compose file) so Traefik had no problem reaching the appropriate internal service. To solve this, we have two options:
- Merge all of our services into one, large
docker-compose.ymlfile. (eew for me) - Use an external docker network to glue the appropriate services together (yum for me!)
I think this will in part be a personal preference thing. I chose separate compose files for a few reasons, but not all services I use have a web UI (or TCP/UDP service for that matter), and as a result has no business allowing connectivity between Traefik and the service. When you create a docker network and connect services to it, it means that you can reach other services by name. Say we have a network called bar, and services called foo and baz. They will be able to reach each other using the hostnames foo.bar and baz.bar. Pretty cool heh. Gluing Traefik to smokeping using this concept is pretty easy. We need to create the network, then specify the appropriate network tags for the services that should be in it.
So, create the docker network that you want to use for any service that Traefik should be able to reach with docker network create web. Here I called the docker network web.

Next, edit the Traefik stack, adding it to the web docker network.
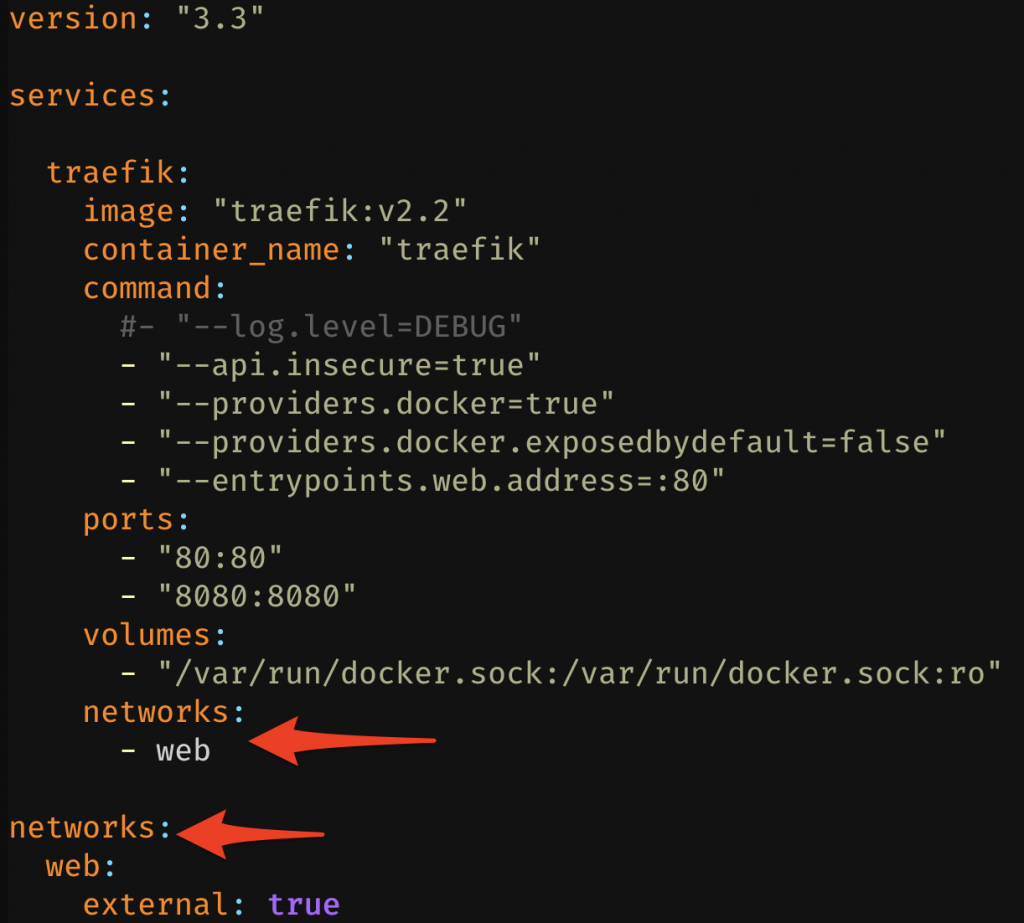
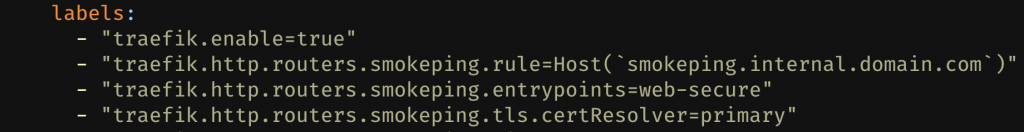
With the Traefik stack configured we can move on to the smokeping configuration again. Edit the stacks docker-compose.yml file and make the following changes:
- Remove the
portstag. This does not have to be exposed to the world anymore. Traefik will take care of this. - Add the networks config (both the
networkstag next toservicesas well as thenetworkstag inside thesmokepingservice definition). - Add the labels which will instruct Traefik to route requests coming in the web entrypoint (port 80) for
smokeping.internal.localto thesmokepingservice. Traefik will resolve the service host for smokeping as smokeping.web automatically. So, those labels are:
labels:
  - "traefik.enable=true"
  - "traefik.http.routers.smokeping.rule=Host(`smokeping.internal.local`)"
  - "traefik.http.routers.smokeping.entrypoints=web"
Your configuration should look something like this now.
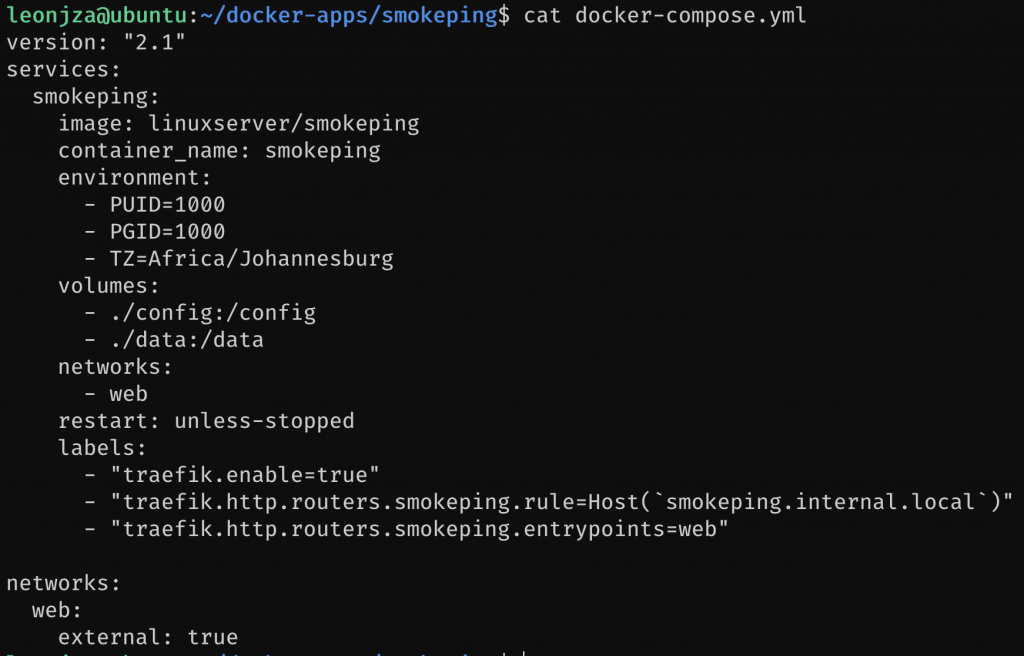
Thats it. Run docker-compose down and then docker-compose up -d, give everything a few seconds and browse to http://smokeping.internal.local.

Cool! We have removed the port 80 binding from the smokeping container and gave it to Traefik. Now, lets add the remainder of the services we configured previously.
traefik – routing netdata and pihole
In this section we will be doing pretty much exactly what we did for smokeping. Update our local hosts file temporarily with new hostnames; remove the service specific web port bindings (except for DNS for pihole, for now :P); add the appropriate labels to route our services and finally connect them to the web docker network.
For hostnames I went with netdata.internal.local and pihole.internal.local.
For netdata, the new labels will be:
labels:
  - "traefik.enable=true"
  - "traefik.http.routers.netdata.rule=Host(`netdata.internal.local`)"
  - "traefik.http.routers.netdata.entrypoints=web"
For pihole we need to add one extra configuration label to specify the port where the web server lives (remember it also has DNS-related port mappings). Its labels will be:
labels:
  - "traefik.enable=true"
  - "traefik.http.routers.pihole.rule=Host(`pihole.internal.local`)"
  - "traefik.http.services.pihole.loadbalancer.server.port=80"
  - "traefik.http.routers.pihole.entrypoints=web"
All three web services should now be available, without anyone fighting over port 80. It also means that services on ports like 19999 are also accessible on port 80 now.
There is one question to be asked here though. Both smokeping and pihole served their web interfaces using port 80, but netdata served it on port 19999. Yet, the configuration for netdata did not need the loadBalancer specification for the port like pihole did! That is because Traefik is smart enough to sniff the EXPOSE directive set for a Docker image and use that as the server port for a service. For example, netdata sets it here. It often happens that you have a service that does not do that, or has multiple ports (and Traefik gets it wrong). In those cases you will have to specify the target port using the loadBalancer label described in the docs here.
Also, notice how you have not touched your Traefik stack while configuring the others…
traefik – dashboard
Traefik has a web based dashboard that can give you a high-level overview of all of the active configuration. This includes entrypoints, routes and services. The default configuration enables this with the "--api.insecure=true" command entry making it accessible on port 8080 on the Pi. You can remove the 8080 port mapping and enable the dashboard using a few labels on the traefik service instead.
labels:
  - "traefik.enable=true"
  - "traefik.http.routers.api.rule=Host(`traefik.internal.local`)"
  - "traefik.http.routers.api.service=api@internal"
  - "traefik.http.routers.api.entrypoints=web"
With the labels added, docker-compose down and docker-compose up -d and browse to the new service url.
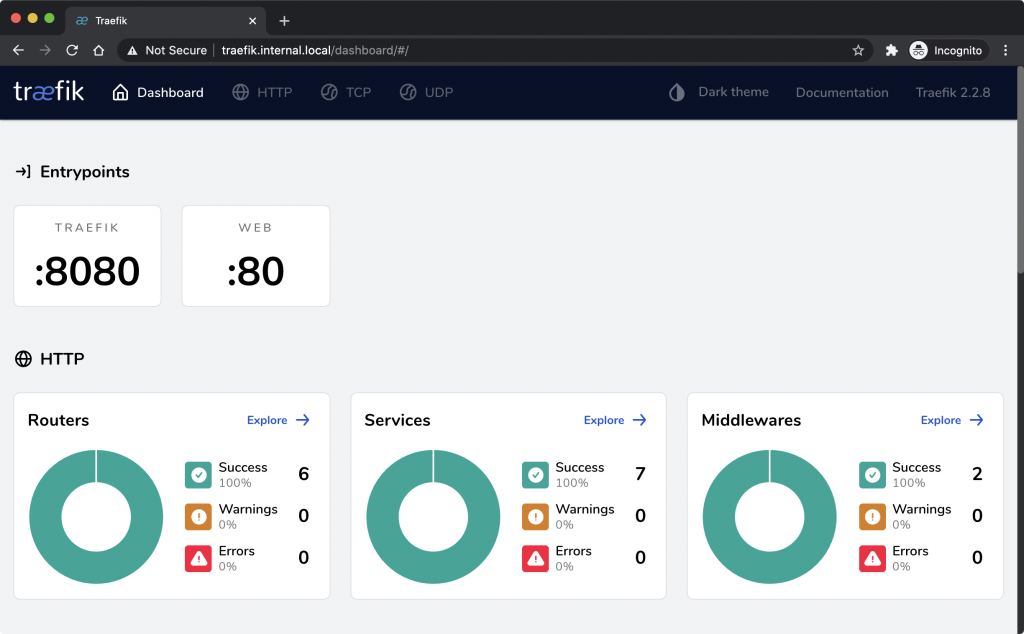
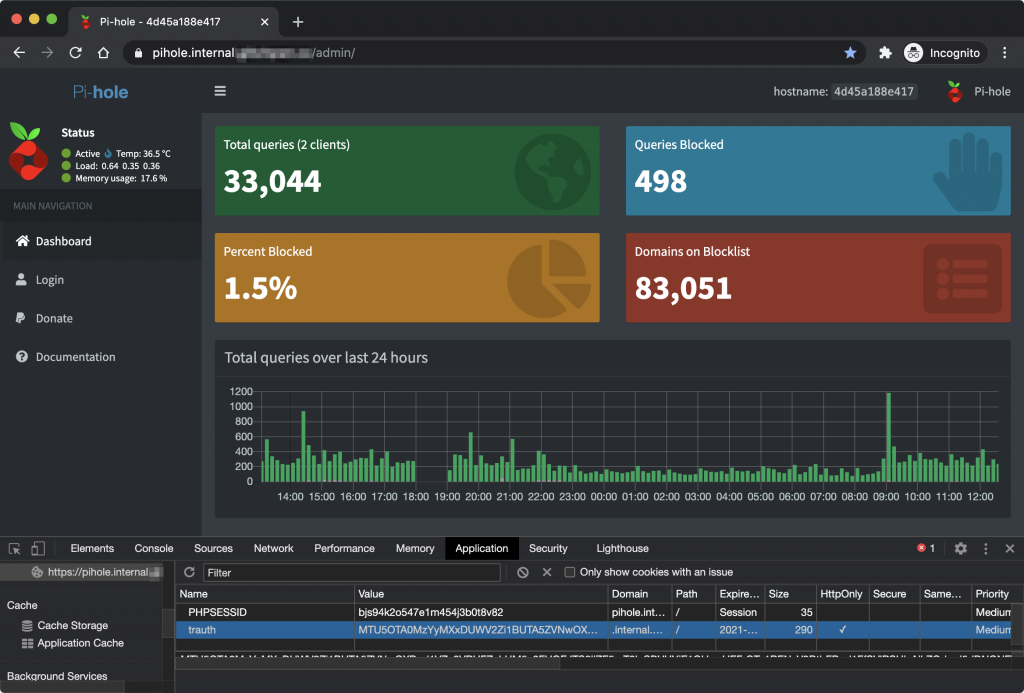
Keep in mind, this dashboard has a lot of information about the services it’s fronting, so keep it secured! The way I did that was with a custom forwardauth implementation discussed later in this post.
networking
There are lots of improvements that can be made to our setup. Hacking away at our /etc/hosts file is not great, specially for the long run. Also, we are only serving our services using plaintext HTTP; another no no. Finally, I wanted to be able to reach services on my Pi from the Internet, without placing it on the Internet, so there is another opportunity for improvement.
DNS
It’s always DNS. Well, in this case maybe not, but like I said, /etc/hosts is not a great solution for our services. In fact, almost anything else will be better. In my case, I own an external domain that I decided I was going to use a sub domain for internal stuff. If you don’t have one, you can get some really, really cheap ones off sites like Namecheap. I also really like Cloudflare’s DNS management portal (which is free to use btw!), so I usually update the NS records for the domain to point to Cloudflare. Using Cloudflare is really a personal preference thing, and everything that we are going to do with Cloudflare here is possible on Namecheap’s DNS management console as well (and many others).
Anyways, the reason I mention this is because of a feature called wildcard DNS. Basically, having an entry such as *.internal.domain.com (using Cloudflare in my case) pointing to your Pi’s internal IP means you can spin up a service on that subdomain and it will resolve to your Pi. Think smokeping.internal.domain.com, netdata.internal.domain.com etc. All of them will resolve to the Pi where Traefik is running. Pretty cool. You could of course use other solutions such as unbound, dnsmasq or whatever. The point is just that wildcard DNS to your Pi is what you want in the end.
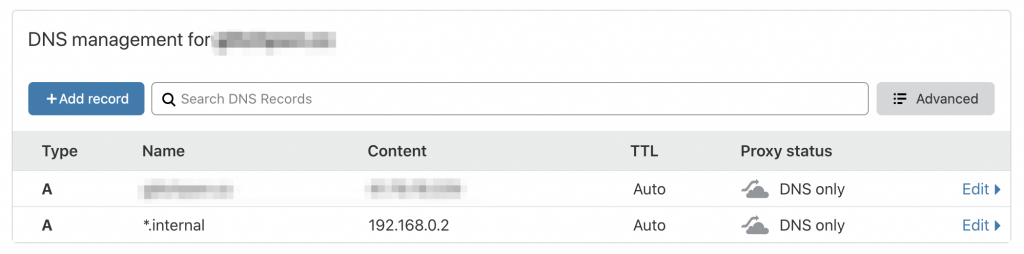
With a wildcard DNS configuration on a subdomain, you can remove those entries in your /etc/hosts file and update the Host() labels in your services to match the domain you have.
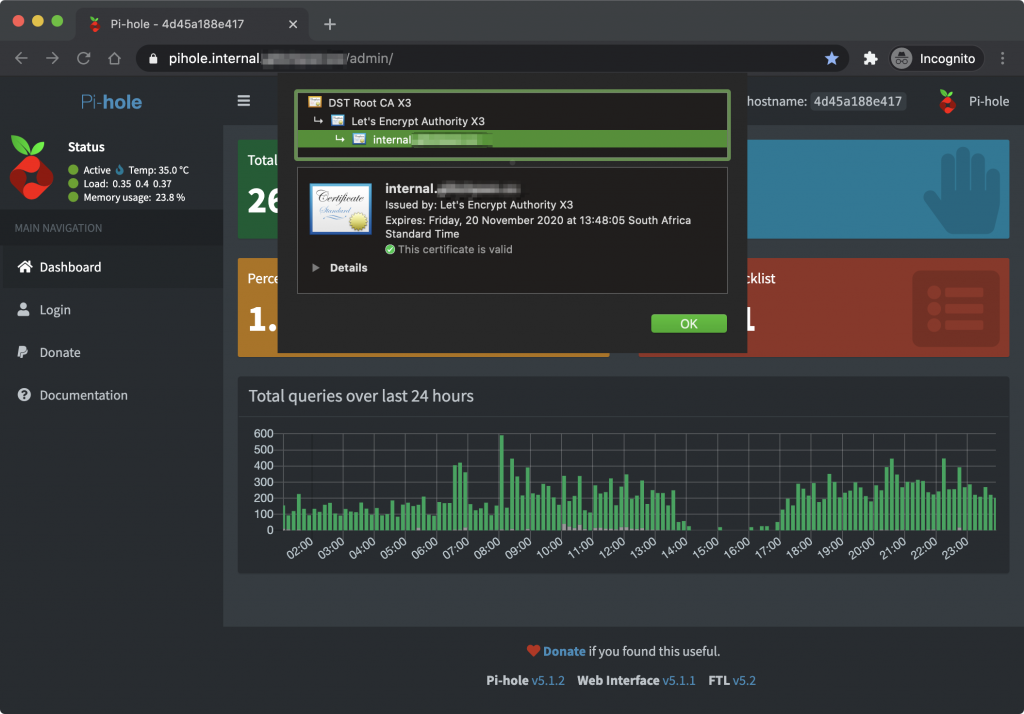
TLS
If you don’t pay close attention to this, this part could be indistinguishable from magic. Using Traefik, we can get automated TLS configurations using Let’s Encrypt. That means valid TLS certificates for web interfaces, on the internal network! What’s more, this can happen even though the Pi is on a home network behind a NAT. Yes, you read right.
A common (if not the most common) method for obtaining Let’s Encrypt TLS certificates is using what is known as the HTTP-01 challenge type. Basically, you prepare and serve using a web server a special token received from your ACME client that Let’s Encrypt will come and check from the Internet’s perspective. If it’s valid, you get a cert. As you can imagine this is a problematic challenge type given that our Pi is behind a NAT / firewall. Thankfully, another challenge type exists called DNS-01. This challenge type works on the premise that the special token is configured as a DNS TXT record instead that Let’s Encrypt checks. It also has the added bonus that it supports wildcard certificates (which is great!).
Here comes the kicker, Traefik has the ability to use many providers API’s (such as Cloudflare) to programatically configure DNS records, and by extension, can configure the DNS TXT record Let’s Encrypt will come and check. That is how we can get valid certs internally.

Configuration will depend on your provider, but for Cloudflare you will need to provide Traefik with some API credentials to use via environment variables. Since we have only been serving our web interfaces using HTTP so far, we also need to add some configuration to listen on TCP port 443. The changes we will make will be :
- Create a new entryPoint for
:443 - Configure a certificate resolver to use the DNS challenge type. We will also be making use of a wildcard certificate; I don’t want actual hostnames popping up in certificate transparency logs!
- Configure an
acme.jsonfile’s permissions where certificate private keys will be stored - Update service entrypoints to use the new web-secure entrypoint that we will create as well as the certificate resolver we added.
As far as the new entrypoint goes, that is pretty simple. Add a new command array item that says --entryPoints.web-secure.address=:443. Next, add a new entry to the ports array so that Traefik actually listens on it like this: "- 443:443". With that done we have both a web and web-secure entrypoint.
As for the certificate resolver (the term Traefik uses to know how to get certs), we need to add a few lines to the command array. Most of them are self explanatory, but if you need to, feel free to refer to the docs for more verbose explanations. The lines for the command array to add a new certificate resolver called primary would be:
command:
  ...
  - --certificatesResolvers.primary.acme.email=you@domain.com
  - --certificatesResolvers.primary.acme.storage=acme.json
  - --certificatesResolvers.primary.acme.dnsChallenge=true
  - --certificatesResolvers.primary.acme.dnsChallenge.provider=cloudflare
  - --certificatesResolvers.primary.acme.dnsChallenge.delayBeforeCheck=0
For wildcard certificates, we need to add some labels to the traefik service telling it what the base domain should be as well as adding a SAN with *. Those configuration labels are:
labels:
  ...
  # wildcard certs
  - "traefik.http.routers.api.tls.domains[0].main=internal.domain.com"
  - "traefik.http.routers.api.tls.domains[0].sans=*.internal.domain.com"
The acme.json file is a special file that needs to be secured as it contains the private keys for all of the certificates that get generated. Just like an SSH key, Traefik will fail if the permissions for acme.json is not set to be 600 (-rw). It is a good idea to make this file available regardless of container restarts, so we will mount it as a volume. First, create the file called acme.json and change its permissions:
leonjza@ubuntu:~/docker-apps/traefik$ touch acme.json
leonjza@ubuntu:~/docker-apps/traefik$ chmod 600 acme.json
Next we will mount that new acme.json file into the Traefik container with another entry to the volumes array that reads: "./acme.json:/acme.json". Once that is done, do the docker-compose down and docker-compose up -d sequence again, and watch the services’ logs for any errors.
Finally, we will update our services to make use of the new HTTPS configuration. With Traefik configured, this is all you will need to configure in the future for your services. The only changes needed will be to update the entrypoint from web to web-secure and to add the certResolver configuration. Once thats done, restart the service stack and wait a bit for the TLS configuration magic to happen!
tcp & udp support
All of our web services are now fronted with Traefik with fancy domain names and valid TLS certificates, but Traefik also supports TCP and UDP. In the case of our Pihole installation that listens on UDP and TCP port 53 to serve DNS lookups, this means we can move that to Traefik and remove the host port mapping the service uses. This makes things nice and neat from a configuration perspective as we will only be exposing ports from Traefik now, and not from arbitrary services. The setup is pretty simple too.
- Create port mappings for TCP and UDP 53 in the
traefikservice - Create new traefik entrypoints using the command line configuration
- Create TCP and UDP service labels to bind incoming connections to pihole
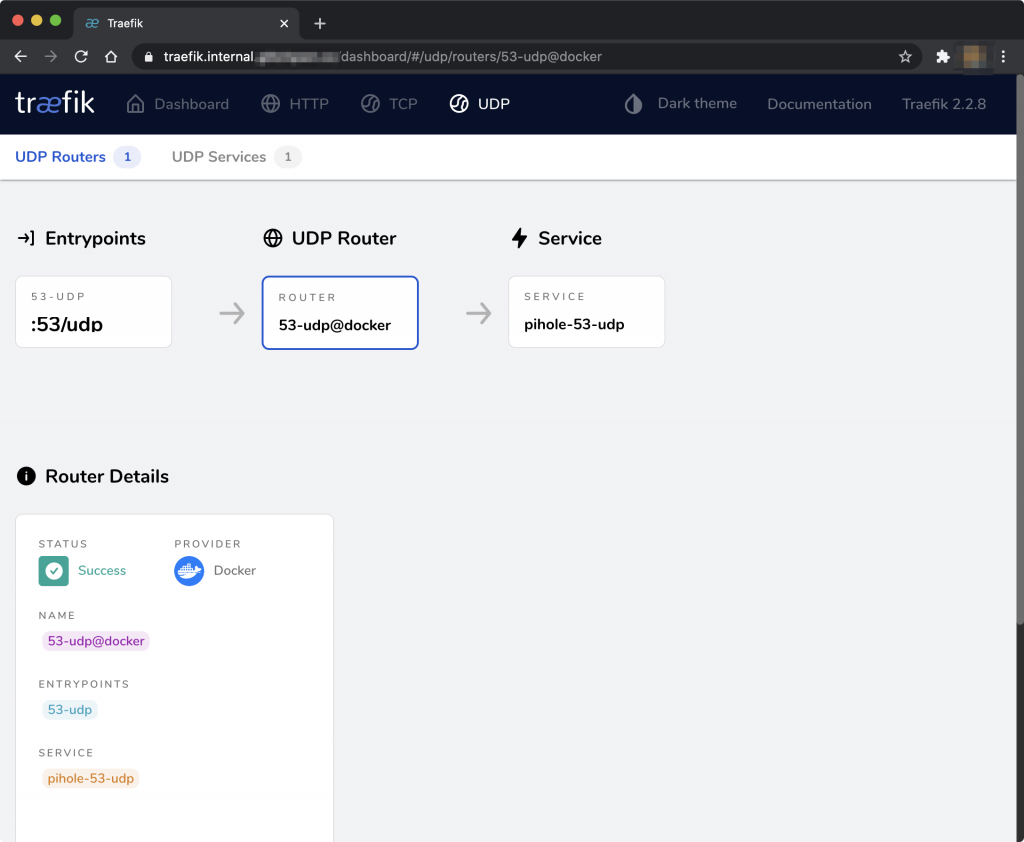
There are some subtle differences in how TCP and UDP connections are handled. It is possible to use SNI (implying the use of TLS and by extension valid certs :P) to route to different TCP services using the same entrypoint in Traefik. Pretty much just how HTTP routes work. However, UDP services do not support this. Instead, an entry point (aka, a UDP port) can only be mapped to a single service. For us this is not a problem; pihole will be the only service using UDP and TCP port 53. As far as labels go, these are the ones you will use on the pihole service after configuring the necessary entrypoints on the traefik service:
labels:
  ...
  # 53/udp
  - "traefik.udp.routers.53-udp.entrypoints=53-udp"
  - "traefik.udp.routers.53-udp.service=pihole-53-udp"
  - "traefik.udp.services.pihole-53-udp.loadbalancer.server.port=53"
  # 53/tcp
  - "traefik.tcp.routers.53-tcp.rule=HostSNI(`*`)"
  - "traefik.tcp.routers.53-tcp.entrypoints=53-tcp"
  - "traefik.tcp.routers.53-tcp.service=pihole-53-tcp"
  - "traefik.tcp.services.pihole-53-tcp.loadbalancer.server.port=53"
In these labels we are specifying new traefik.udp and traefik.tcp routers and services. The entrypoints match the entrypoint names we give in the traefik service. Take note of the TCP router having a HostSNI() rule with a wildcard. This means that any connection coming in on port 53/tcp will match this rule, routing it towards pihole.
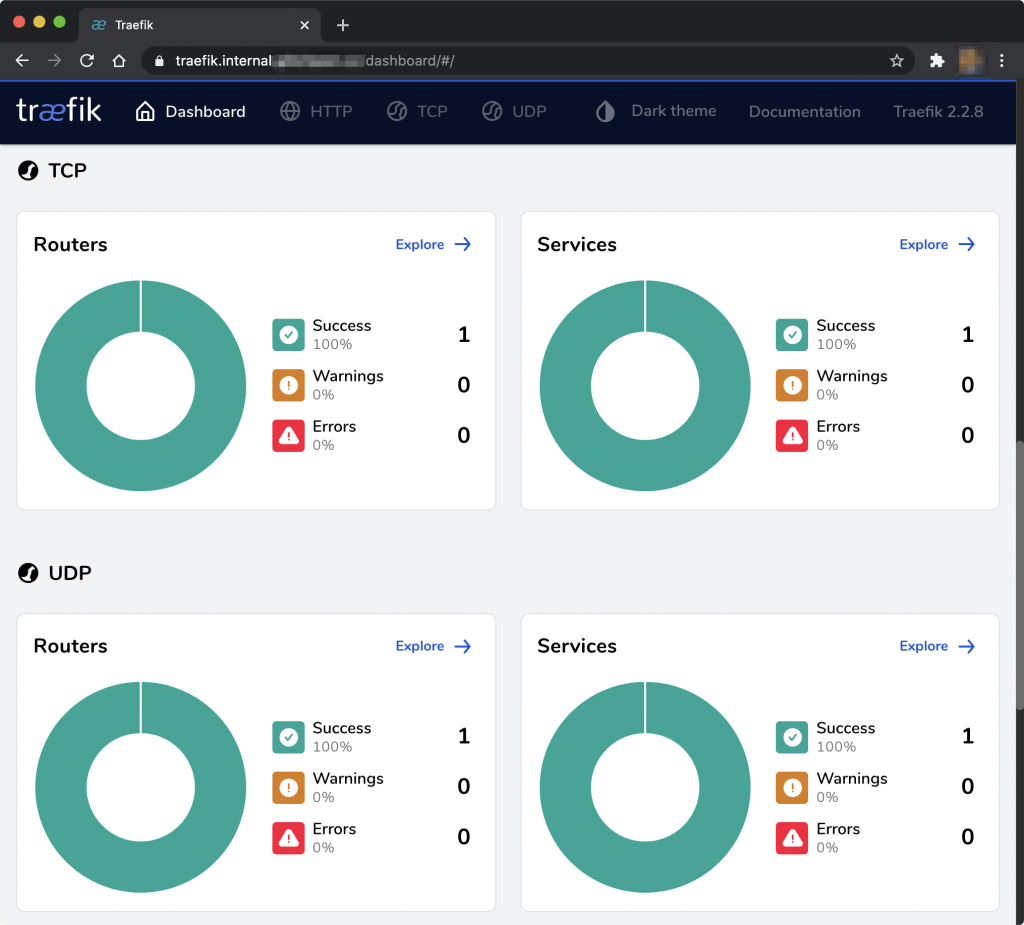
With this configuration applied (restarting the relevant services), you should see some new TCP and UDP services pop up in your Traefik dashboard.
configuration backups
The entirety of our setup lives in the docker-apps folder we have been using. The majority of the setup is also just a bunch of docker-compose.yml files. Depending on the services you use some will also have external configuration mapped to containers.
So, for configuration backups I use a private git repository hosted on Github to store everything. In each folder I use a .gitignore file to exclude stuff from git (such as databases and other stuff I don’t want to store in git), but essentially all of the changes I make get pushed to git. This way, should disaster strike (which it has), I can clone and up the services again with minimal work.
base setup summary
Wow, you read all the way up to here? Nice :P These are really just the basic building blocks for how I built the setup. To recap, here are some of the important take aways I think you should get from this:
- Docker (and by extension docker-compose) is an incredibly powerful way to orchestrate small “stacks” of services.
- Traefik makes it easy to perform configuration discovery of your Docker services having only applied some labels.
- We can “front” / “forward” traffic from the outside world into the Docker world via Traefik, making it the only container that exposes ports to the host. Everything else can be inter-container communications.
- Having valid TLS certificates, even on an internal network, really should be the norm. With wildcard support you don’t have to worry about internal hostnames popping up in Certificate Transparency logs either.
- Git is great for config backups!
customisations
From here on onwards I am going to show some of the extra customised configurations, setup and code I wrote. Most of these are specific to my use case, but hopefully you can get some new ideas, or learn a trick or two. Service wise, everything will follow the same pattern with Traefik fronting it where it makes sense.
forwardauth
Many services that have web interfaces show statistics and other things I don’t really like having open without authentication. The Traefik dashboard and netdata are great examples of this. I wanted to secure these somehow, and Traefik makes this easy. Traefik has the ability to apply “middleware” to routes that make it possible to do a a whole bunch of crazy things like modifying requests, mirroring requests, applying compression to responses and many many more. From a security perspective, there is the BasicAuth middleware where we can with a single label apply an auth requirement for an HTTP route. At first glance this may sound perfect, but when you are dealing with many, many services, this quickly becomes a messy copy/paste job adding the label where you want the auth. Depending on your browser, the handling of basic auth may also not be as predictable, meaning you will often need to re-authenticate. An alternative middleware exists and it’s called ForwardAuth.
ForwardAuth is pretty cool. Basically, once configured incoming requests will first check in with an AuthServer if the request should continue or not. The AuthServer that ForwardAuth checks in with can be anything, as long as it returns an HTTP 200 to indicate to Traefik that the request should continue. Any other response will be bubbled up back to the client. The Traefik ForwardAuth docs has a great diagram illustrating this flow.

There are a few existing ForwardAuth compatible AuthServer projects on Github, but almost all of them implement some sort of OAuth flow with identity providers such as Google. I did not want that. Instead, I liked the idea of just having some basic auth in front of my web services, and decided to build my own.
This resulted in me building trauth, a simple basic authentication ForwardAuth compatible AuthServer. Michael also built something similar that handles authentication using a web form, so go check that project out if you prefer that over a basic auth prompt!
The cool thing with something like trauth is that if you configure it to protect multiple web services, you only need to authenticate to one service and you will be authenticated to all. This is because in the basic auth response a cookie scoped for your domain gets set in the browser. So, when trauth sees this and the cookie is valid, it will respond with an HTTP 200. In my experience, for the most part once you have authenticated you mostly forget it exists unless your browser changes or the authentication cookie expires.
As far as setup goes, I added a trauth service to my existing traefik setup like this (after preparing the htpass file).
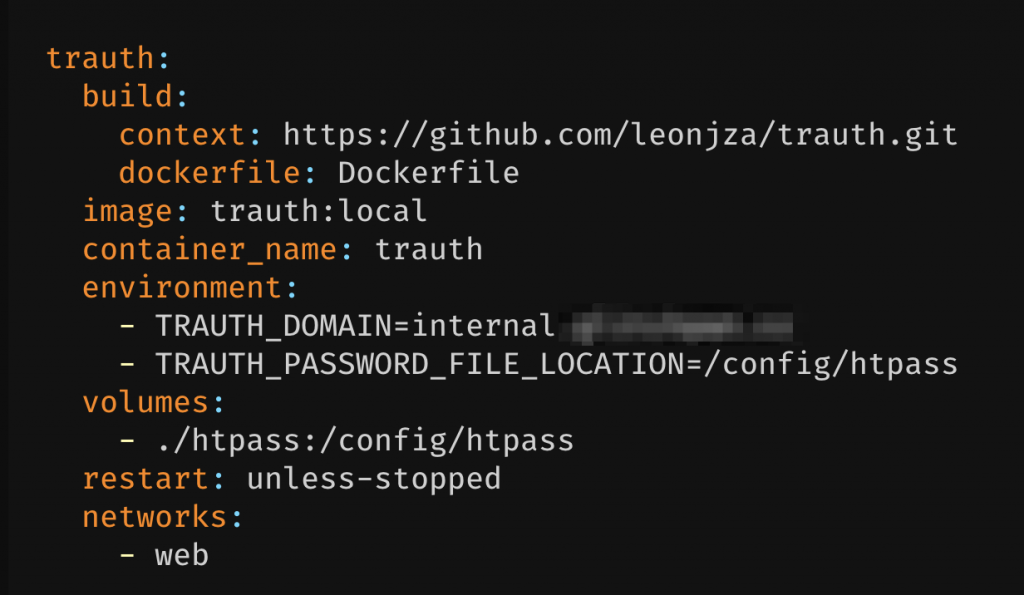
Notice how the services has a build tag. I mentioned this earlier in the post, but that is because I don’t have an ARM image on Dockerhub for it. With the build tag docker-compose will build the image from the Github repository for you.
The next part is to add a label to the traefik service, telling it to setup a new middleware called trauth of type forwardauth, and specifying where the service lives.

Here my AuthServer is http://trauth.web:8080/ because trauth is the service name connected to the web docker network. The other cool thing about this setup is that you don’t have to expose the AuthServer to the world (with labels), but instead can leave it isolated to the docker network. Traefik will be the only service calling it, forwarding responses as needed.
Finally, to have services use this new middleware (effectively protecting them with basic auth), add the following label "traefik.http.routers.pihole.middlewares=trauth" and restart the stack.
I use the trauth middleware for all of the exposed web services, regardless if the service itself has its own authentication too.
telegraf, influxdb & grafana
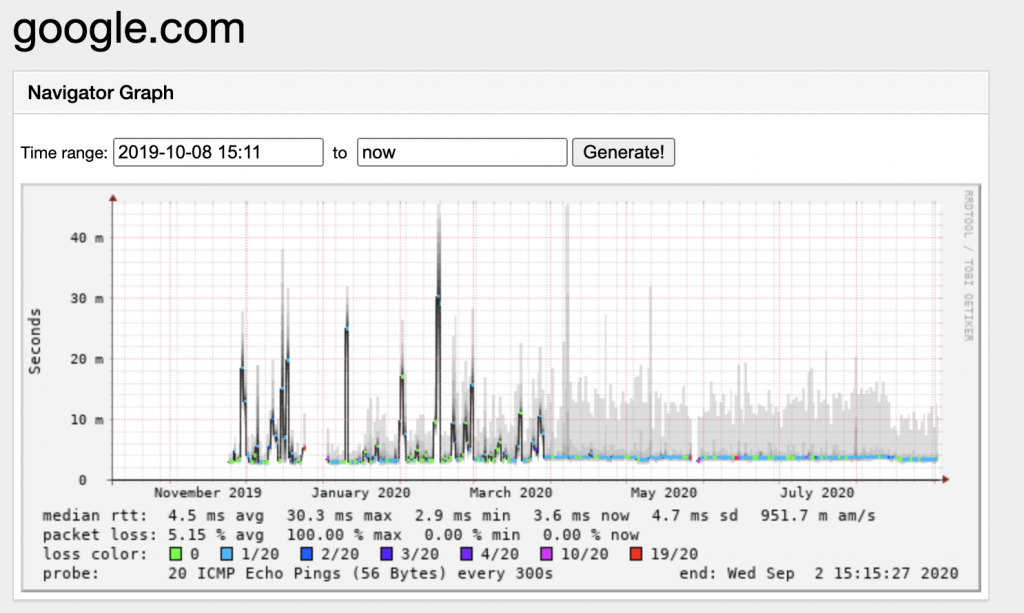
I don’t know about you, but I love graphs. A lot. Smokeping was the very first service I configured so that I could see what my Internet connections’ quality was like over time.
I had come across Grafana at clients before, but never really understood what made up those amazing graphs. So, in an effort to better understand those (and get some graphs of my own), I went down a deep rabbit hole of figuring it out. I don’t think I should dive into too much detail, but rather quickly go over the parts that make up what is called the TIG stack, and then dive into the setup.
The TIG stack is the collection of Telegraf, InfluxDB and Grafana. Telegraf is a data collection agent (with an impressive amount of support for various things like SNMP, ICMP etc.) that saves results into InfluxDB which is a time series database (with a really simple protocol!). Finally, Grafana is the graphing UI that can query many databases, including InfixDB. From this data, Grafana can visualise data in some incredible ways. Anything from system performance metrics, to custom stuff you cook up yourself is possible!
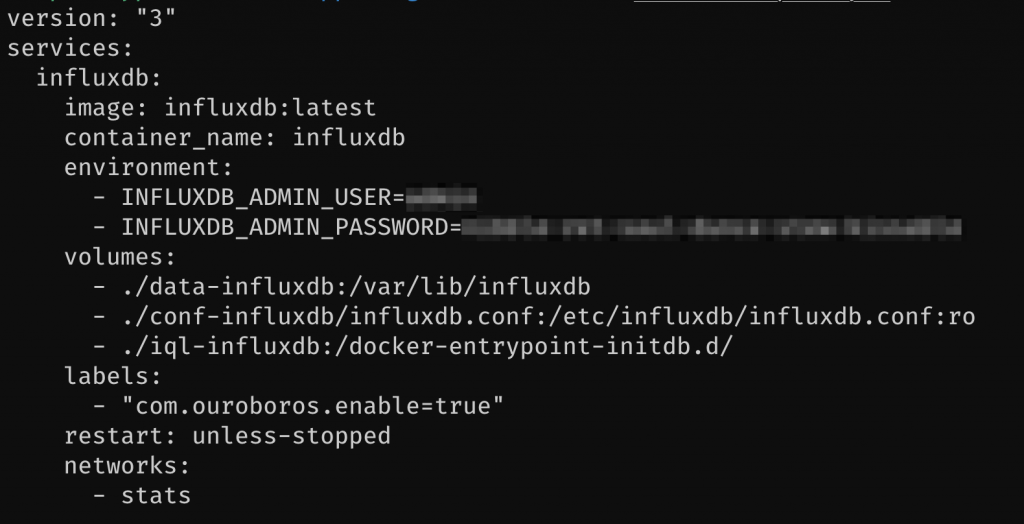
To no-ones surprise, all of the software that make up the TIG stack can run in Docker containers, and by extension can be glued together with a docker-compose file. Each image requires its own set of configuration, eg. InfluxDB wants administrator credentials and so does Grafana. Telegraf on the other hand needs a configuration file which you can generate once-off and then mount into the container. I am not going to go into the details of all of those as they are pretty well documented on each project’s Dockerhub page.
What we will dive into a bit is the networking setup for the TIG stack. From the outside, only Grafana needs to be exposed to the world. Using Traefik and the setup described earlier in this doc, that is exactly how I did it. What is different though is that I opted to add another docker network called stats in addition to the existing web network. The idea being that any of the services inside of docker that need to talk to the TIG stack (either to fetch or push stats via Telegraf or directly to InfluxDB) can do so via the stats network. Web related stuff that need to be accessed from Traefik can do so via the web network. This made it quite easy for me to distinguish the different services, and at a glance gives you an idea of where they fit in.
For example, the influxdb service does not have to be exposed to the outside world via Traefik, so it is not part of the web network. However, if something wanted to POST data to the InfluxDB HTTP API, that service will have to also be attached to the stats network to reach InfluxDB. Anyways, with the stack up, I can reach the Grafana instance running on the Pi from the outside.

Out of the box Grafana is not really useful, so lets change that!
tig – traefik metrics
Traefik can send usage metrics to an InfluxDB database. The configuration is quite well documented as well. You basically just have to enable metrics submissions, tell Traefik where the InfluxDB instance lives, give it some credentials and then restart the stack. In the command array of the traefik service, I had to add these entries (we’ll dive into the details in a moment):
  - --metrics.influxdb=true
  - --metrics.influxdb.address=http://influxdb.stats:8086
  - --metrics.influxdb.protocol=http
  - --metrics.influxdb.pushInterval=30s
  - --metrics.influxdb.database=traefik
  - --metrics.influxdb.username=traefik
  - --metrics.influxdb.password=******
Notice how the location for InfluxDB is at influxdb.stats. That is because its available in the stats network only, which also means I had to attach the traefik service to the stats network.
networks:
  - web
  - stats
The next part I want to touch on are the credentials I provided. Those credentials are *not* the admin credentials I specified in the influxdb service, but rather a fresh set of credentials for a fresh database. I created those using an InfluxDB “iql’ script. If you noticed in the previous section where I showed the influxdb services’ schema, there was a volume mounted with ./iql-influxdb:/docker-entrypoint-initdb.d/. With this mount, when InfluxDB starts up it will read and process any .iql scripts that are in the folder. I have an init.iql script that configures databases & credentials for me, similar to this (stored in git):
CREATE DATABASE "traefik";
CREATE USER "traefik" WITH PASSWORD '*';
GRANT ALL ON "traefik" TO "traefik";
Alright, so now you know how Traefik can talk to InfluxDB, so restart all the relevant stacks and you should see a POST in the influxdb‘s service log coming from Traefik.

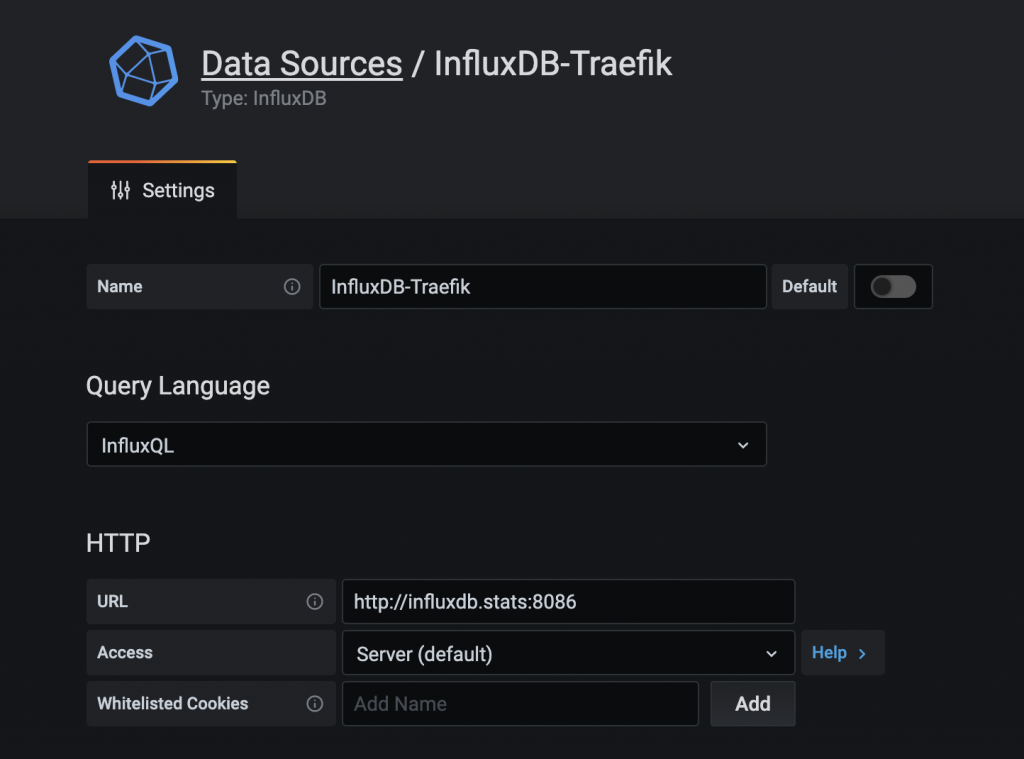
With measurements in the InfluxDB database, the next part is the fun part. Visualising it! Before we get to that though, we need to connect InfluxDB and Grafana so that Grafana can actually query the data. In the Grafana UI you can do this by going to Settings -> Data Sources -> Add Data Source -> Choose InfluxDB -> give it a name & creds and save.
Grafana has many pre-built and community contributed dashboards that you can search for and import from here. For Traefik, I used this dashboard. To import an existing dashboard, you can just go to Manage Dashboards -> Import. You will be asked which datasource should be used, so select the one we just set up for Traefik. And voila!
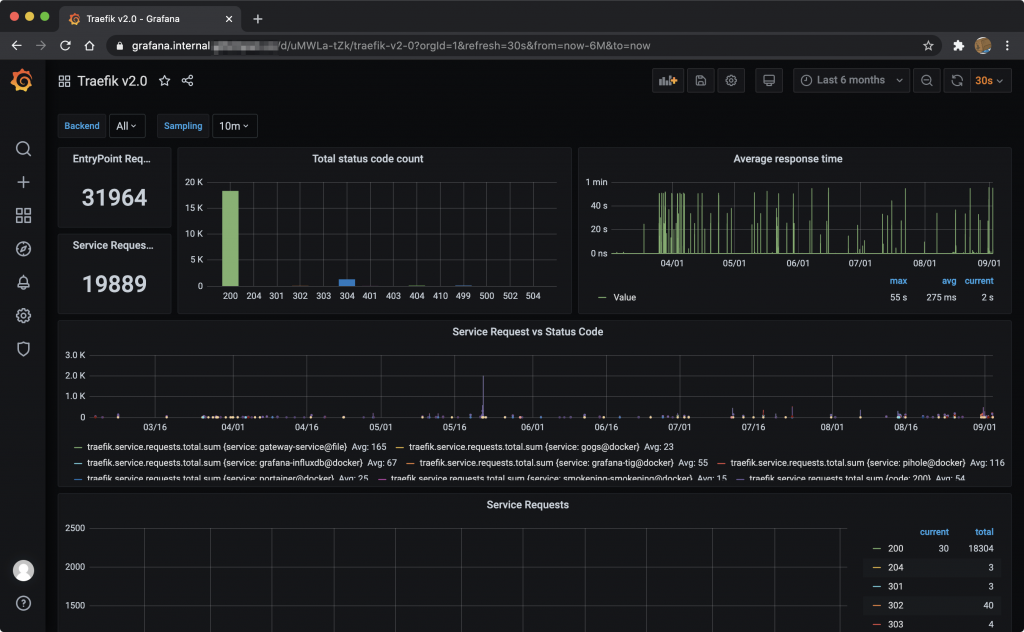
In your Traefik dashboard, you should also see that metrics are now enabled.
tig – ups metrics & alerts
Here in South Africa, we are plagued by what is known as “LoadShedding”. I’ll leave the politics of it for another day, but what it means for us is that depending on how much strain the local power utility provider is taking, we will get scheduled, rolling power outages for a few hours (depending on where you live in the country). So, having a backup power source to continue working is pretty important.
I wanted the ability to monitor statistics provided by my UPS and optionally, get alerts when the power goes out and comes back on again. Grafana has the ability to alert based on thresholds in a graph (we’ll get to that in a moment), so that solves a part of the problem. The next piece of the puzzle was to get statistics from my UPS into InfluxDB. More specifically, I wanted the results one could get from Network UPS Tools (NUT) populated into InfluxDB.
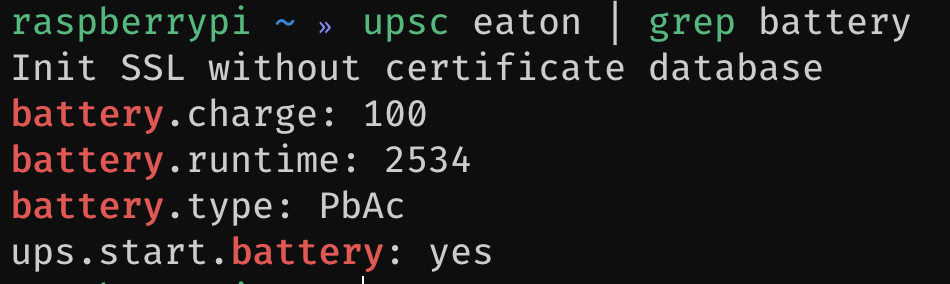
I couldn’t find something that did this exactly how I wanted, so I went and built it instead. I found a Golang NUT client called go.nut and effectively wrote a NUT to InfluxDB translator called nutstat. Once configured, nutstat will poll NUT for data and POST the results to an InfluxDB database using the HTTP API. The readme file for nutstat contains an example docker-compose.yml file you can use to get the utility up and running here. Just like for the Traefik metrics, I added a fresh database and creds for nutstat in the InfluxDB .iql script.
As for Network UPS Tools itself, this was installed on the host OS, mostly because I was having trouble getting it running in Docker with a USB connected UPS.
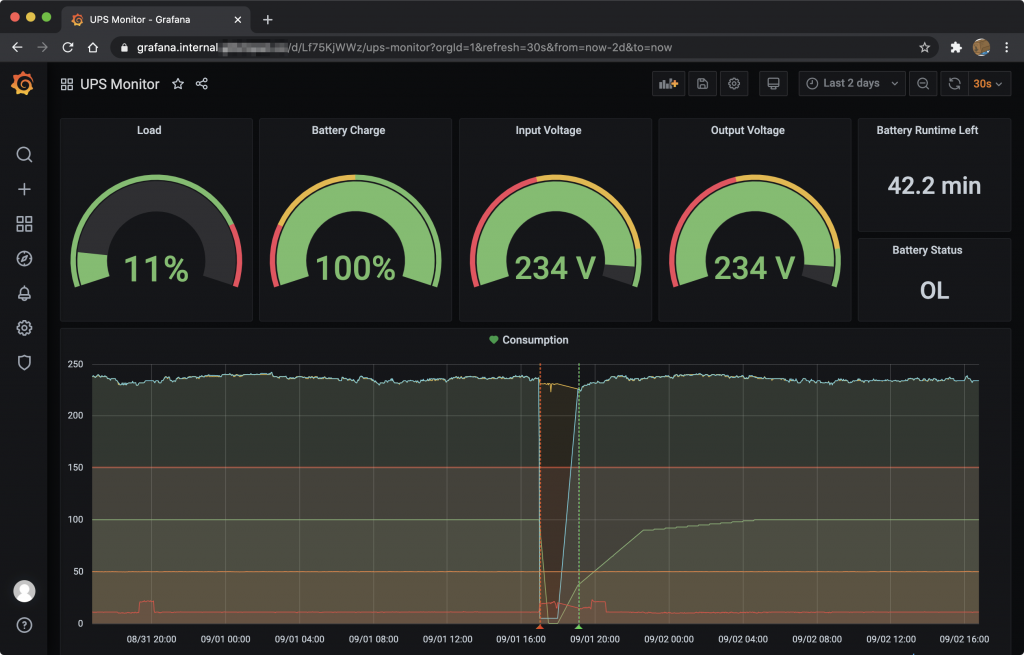
Before we can setup some alerting we have to build a dashboard. Given that I populated a fresh DB with custom data, I also had to manually build the Grafana dashboard. There are thousands of guides online on how to do this, so I am not sure I can add much more. However, the result of the dashboard I have now looks like this:
Grafana can alert based on thresholds that you set in your graphs. Alerts can be sent via many providers which include email, slack etc.
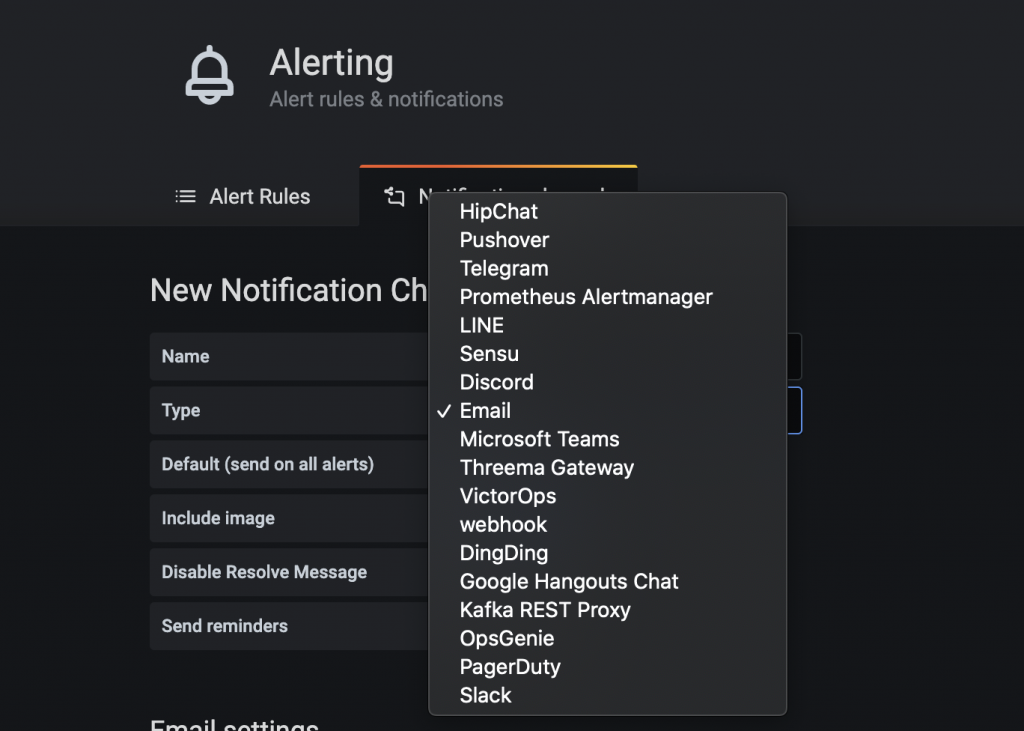
I quite like using Telegram given its support for bots, and with Grafana supporting Telegram it was perfect for me. After following the Telegram guide to configure a bot, you can setup the Telegram notification channel using the resultant Bot API key that you get.
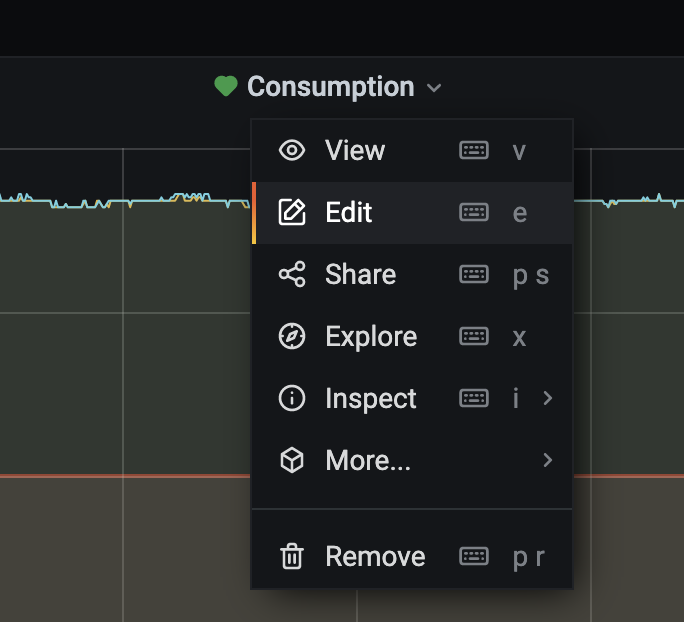
Next, to create an alert you need to edit the panel you want to generate alerts on and browse to the alerts tab.
If you have not created an alert before you’ll get a large “Create Alert” button to press, otherwise you will get the edit alert options.
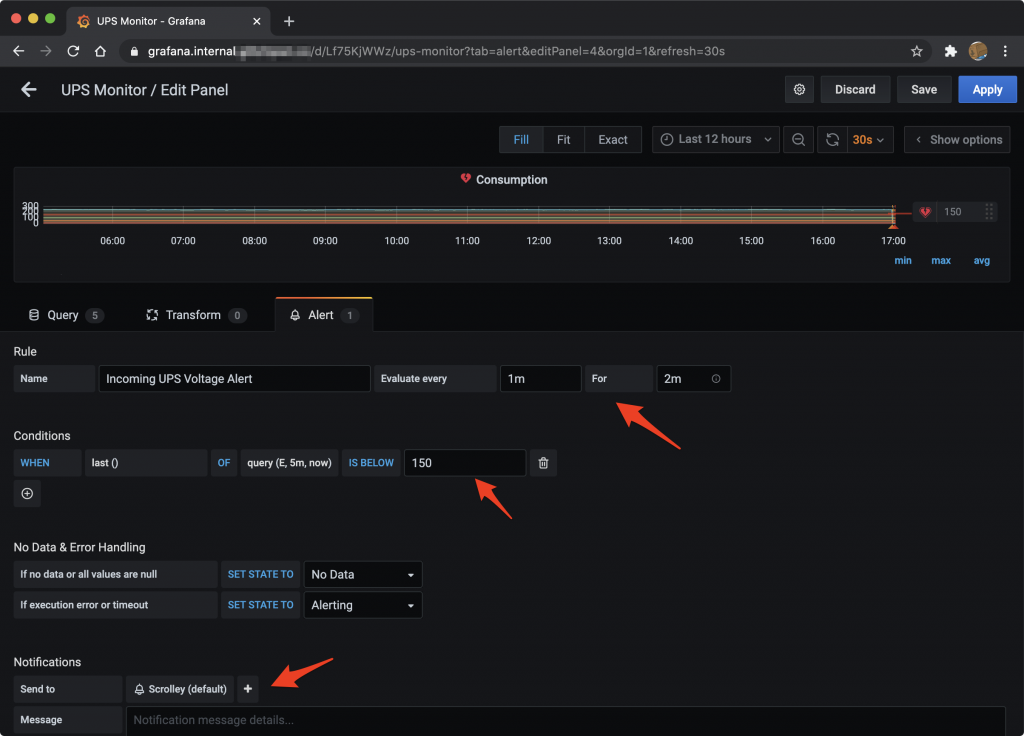
Now, when the alert conditions are triggered (input voltage below 150 for 2 minutes for me), or when the state returns to “normal” (input voltage above 150), I receive Telegram messages.

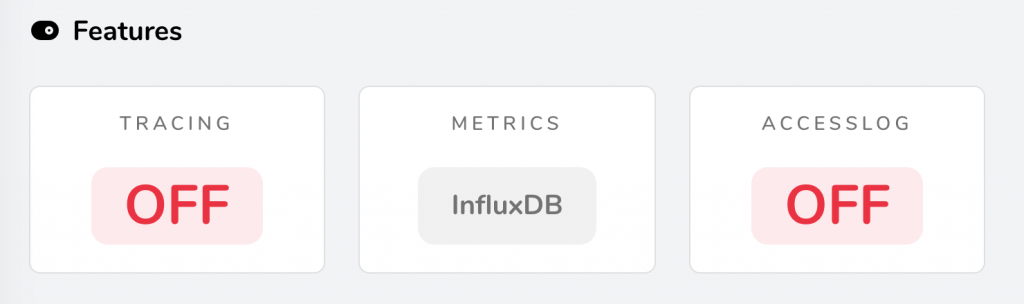
What you will notice is a really cool image of the graph being monitored as well. This was added in Grafana 7, but required a custom renderer to be configured. I added the following service to my TIG stack to support the external renderer feature, built specifically for a Pi.
grafana-renderer:
  image: adejong/grafana-image-renderer-pi:1.0.8-beta2
  restart: unless-stopped
  networks:
    - stats
Next, I just had to tell Grafana where the renderer service was via environment variables.
  # Render information
  - GF_RENDERING_SERVER_URL=http://grafana-renderer:8081/render
  - GF_RENDERING_CALLBACK_URL=http://grafana:3000/
remote access
I did not want to expose the Pi or any of its services directly on the Internet. But, I figured it would be great if I could reach it from the Internet to check out some of those graphs, or if I needed shell access on the Pi itself. So, I opted to configure some WireGuard tunnels to a cloud VPS allowing me to connect to the VPS from anywhere and reach the services on the Pi. Obviously this implies that a tunnel from the Pi to the VPS also had to be configured.
The basic idea is that the tunnel from the Pi to the cloud VPS would allow access to my home IP range over the tunnel. So when my phone or laptop connects via WireGuard to the VPS, it can also reach the internal network at home. With the wildcard DNS configuration sitting at Cloudflare, DNS resolution should work fine too!
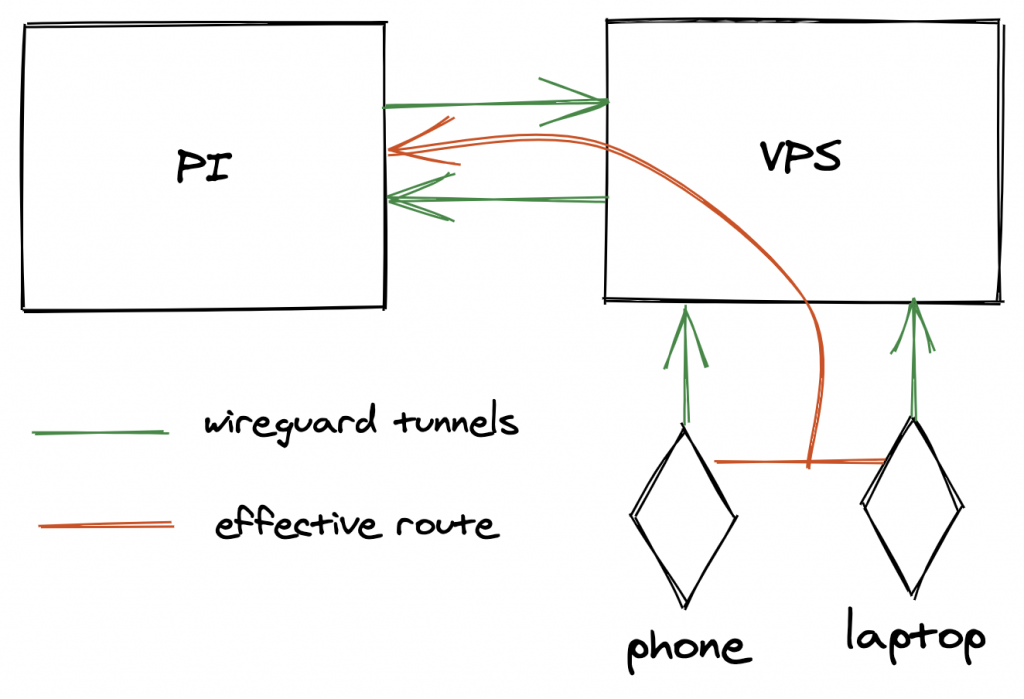
WireGuard was also on the host OS and not in Docker. It is definitely possible to run it in a container, but I was more comfortable running this on the host OS.
static configurations
As if using dynamic configurations from Docker wasn’t enough, you can also define “static” config for Traefik. I used this to also front my home routers web interface with Traefik. Silly, but why not? To enable a static config, all you need to do is tell Traefik which file it should parse with --providers.file.filename=/static.yml in the command array, and then mount in a file from the outside to /static/yml. Next, add your configuration! I just use it to front my router, so its really simple.
http:
  services:
    gateway-service:
      loadBalancer:
        passHostHeader: false
        servers:
        - url: "http://<router ip>/"
  routers:
    gateway:
      tls:
        certResolver: primary
      rule: "Host(gateway.internal.domain.com)"
      service: gateway-service
automatic updates
So we have configured a boat load of services, but how do we keep them up to date? I sure as heck don’t want to log in every so often and do it manually, so instead I use something called pyouroboros. Using this image from Dockerhub, I have a docker-compose file that runs pyouroboros that will keep containers up to date. It supports Telegram integration meaning I get a notification every time a container has been updated. It also supports InfluxDB, so upgrade stats are stored there too!
With the docker-compose file keeping pyouroboros up, the last bit to do is to label containers you want to form part of the automatic update with "com.ouroboros.enable=true".
conclusion
That… was a lot to read. I had a lot of fun building this setup, and having run it for almost a year now I can also attest to its ease of maintainability. Overall I feel like the setup is pretty clean. The only service exposing ports externally is Traefik, and internally from a Docker perspective there is a small bit of segregation too! Having configuration changes stored in Git also goes a long way to figure out what you were thinking over time. It also a nice reference for future implementations.
I’m sure there are better ways to do some of the things here. For example, having separate compose files is not really necessary as you can separate stacks with ----. However, I have found the service specific restarts in docker-compose to be rather unpredictable, and when I do a docker-compose down, I don’t really want to bring everything down. YMMV. Another consideration here may be to stuff all of this on a small Kubernetes cluster, like k3s. You know, for the learning experience and extra hipster points.
I really hope you managed to pick up a trick or two here, and feel inspired to play with this stuff too. The possibilities are endless!